Cathleen’s perched at a table in Cal’s Coffee Shop, sipping a latte and looking smug. “Hi, Sy.”
“Hi, yourself. Did somebody you don’t like get a well‑deserved comeuppance?”
“Nothing that juicy. Just an old hunch that’s gotten some strong new supporting evidence. I love it when that happens.”
“So what’s the hunch and what’s the evidence?”
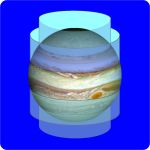
“You’ve already heard the hunch.” <dialing up an image on her phone> “Remember this sketch?”
“Hmmm, yeah, you and Vinnie were debating Jupiter’s atmosphere. Its massive airflows could self‑organize as an oniony nest of concentric spherical shells, or maybe concentric cylinders like that picture on your phone. Later on Vinnie thought up a more dynamic option — cylindrical shells encasing sets of smaller tornados like roller bearings. You shot that one down, right?”
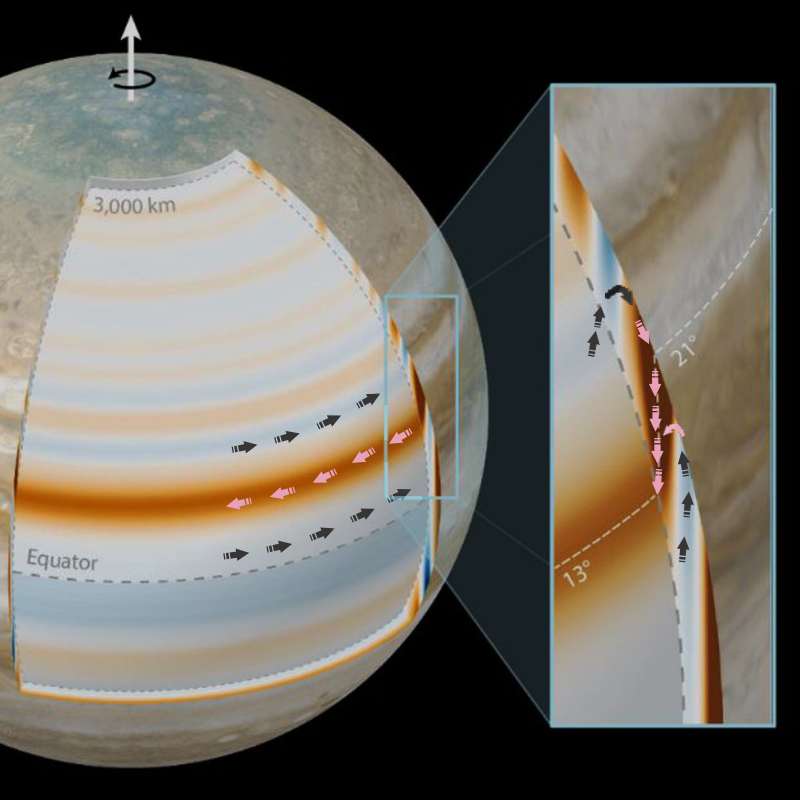
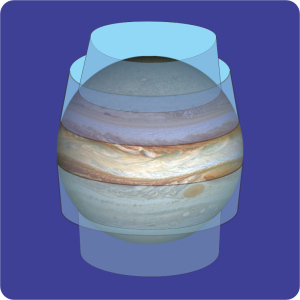
“Mostly. I did admit something like that might work at the poles. Anyway, I’ve liked the concentric cylinders model for quite a while. This paper I just read says I’m almost but not quite right. Kaspi and company’s data says the cylinders are cone sections, not cylinders, and they’re not north‑south symmetrical.” <dialing up another image> “It’s like this except I’ve exaggerated the angles.”
“Doesn’t look all that different to me. Congratulations on the near‑win. What’s the new model based on? Did Juno drop another probe into the atmosphere?”
“Nope. Remote sensing, down as far as 3000 kilometers.”
“I thought Jupiter’s cloud decks blocked infrared.”
“Another nope. Not infrared sensing, gravity.”
“Didn’t know Juno carried a gravimeter.”
“It doesn’t, that’d be way too heavy and complex. Juno itself was the remote sensor. Whenever NASA’s Deep Space Network captured a data transmission from Juno, they also recorded the incoming radio signal’s precise frequency. Juno‘s sending frequency is a known quantity. Red‑shifts and blue‑shifts as received told us Juno‘s then‑current velocity relative to Earth. The shifts are in the parts‑per‑million range, tiny, but each speed‑up or slow‑down carries information about Jupiter’s gravitational field at that point in Juno‘s orbit. Given velocity data for enough points along enough orbits, you can build a gravity atlas. This paper reports what the researchers got from orbits 1 through 37.”
“Cute idea. They’ve built the atlas, I suppose, but what can gravity say about your wind cylinders?”
“Winds in Jupiter’s atmosphere are driven by heat rising from the core. Put a balloon 3000 kilometers down. Heated air inside the balloon expands. That has two effects. One, the balloon is less dense than its surroundings so it rises. Two, the work of expanding against outside pressure drains thermal energy and cools the balloon’s air molecules. The process continues until the balloon gets up to where its temperature and pressure match what’s outside, right?”
“Which is probably going to be well above 3000 kilometers. Hmm… if you’ve got lots of balloons doing that, as they fly upward they leave a vacuum sort of. Excess balloons up top will be pulled downward to fill the void.”
“Now organize all those balloons in a couple of columns, one going up and one down. Will they have equal mass?”
“Interesting. No, they won’t. The rising column rises because it’s less dense than its surroundings and the falling column falls because it’s more dense. More mass per unit volume in the falling column so that’s heavier.”
“Eighteenth Century Physics. Planetary rotation forces columns of each kind to merge into a nest of separate cones. Rising‑column warm cones support Jupiter’s white ammonia‑ice zones. Falling‑column cool cones disclose red‑brown belts. The gravity field is stronger above the dense falling regions, weaker over the light rising ones. Juno responded to gravity’s wobbles; the researchers built their models to fit Juno‘s wobbles. The best models aren’t quite concentric cylinders, because the cones tilt poleward. This graphic tells the story. The rectangle shows a 3000‑kilometer vertical section. The between-shell boundaries are effective — the paper specifically says that mass transport inward from the outermost shell is insignificant.”
“You said the data’s asymmetric?”
“Yep. The strongest part of the gravitational signal came from flow angling down and equator‑ward, 21°N to 13°N.”
“Why’s that?”
“Maybe the Great Red Spot down south drives everything northward. We don’t know.”
~ Rich Olcott

Hi Rich,
So what is the bend in degrees of the magnetic axis?
All the best,
Bill Hyatt
8477 E Hinsdale Dr
CENTENNIAL CO 80112-1909
303.810.1140 (voice/text)
BILLHYATT@MENDENT.COM BILLHYATT@MENDENT.COM
LikeLike
Hey, Bill. As you might guess, it’s complicated. I gather what you have in mind is a N-S bar magnet that’s bent through an angle to make it look like the image in https://solarsystem.nasa.gov/system/resources/detail_files/2451_pia23229_med.jpg. That depends on where the bar’s center lies. Eyeballing the positions from the map at https://www.jpl.nasa.gov/images/pia25035-mapping-jupiters-great-blue-spot, I estimate the red pole to be near 40 N 140 W, and the blue pole to be near 10 S 80 W. If the bent bar passes through Jupiter’s center and is bent there, I get a bend angle near 15 degrees. On the other hand, you could visualize a bar that has a zero bend angle and skips right past the center. Or anything in between. Unfortunately for such visualizations, Jupiter’s true field isn’t a dipole — measurements reveal significant quadrupole and octupole distortions plus lumpiness, as you might expect from a field generated by turbulent motion in Jupiter’s liquid metallic hydrogen core.
LikeLike
Oops. Got that angle wrong. The red pole-to-center-to-blue pole angle is measured along the Great Circle arc between the poles. That comes to 74°. The bend in the bar to get to 74° is the deviation from a straight line, 180°, so the bend angle is 106°. My 15° figure above is the deviation from a right angle, which is just silly. My apologies, Bill.
LikeLike
most interesting. thank you.
LikeLike