

<chirp, chirp> “Moire here.”
“Hello, Mr Moire.”
“Afternoon, Walt. Pizza time again?”
“No, too public. Poor craft to be seen too often in the same place. There’s a park bench by the lake.”
“I know the spot.”
“Fifteen minutes.”
“Twenty.”
“Afternoon, Walt. What are your people curious about this time?”
“Word is that astronomers uncovered a huge amount of matter they’d been searching for. We’re interested in concealment techniques, so we want to know how it was hidden and how was it found.”
“Forty percent of all baryonic matter—”
“Baryonic?”
“Made out of atoms. Baryons are multi-quark particles like protons and—”
“Leave the weeds and get back to the topic. Where was that 40% hiding?”
“In plain sight, all over the sky, in strands forming a network that connects galaxies and galaxy clusters. They’re calling it the Cosmic Web.”
“Something that big … how was hidden?”
“Some techniques I’m sure you’ll recognize. First, the material in the strands is diffuse — just an atom or two per cubic meter. An Earth laboratory would be proud to pump down a vacuum ten million times more dense.”
<taking notes> “Spread your forces so there’s no prime target for counter‑attack, mm‑hm. But if the material’s that thin, surely it doesn’t mass much.”
“Remember how big space is. These filaments span the widths of multiple galaxies. Do the math. A thread could be on the order of 100 million lightyears long by 1000 lightyears in diameter. A lightyear is 1016 meters. The thread has a volume of about 1062 cubic meters. At 10-26 kilogram per cubic meter that’s 1036 kilograms which is comparable to the mass of a small galaxy. That’s just one thread. Add them up and you get roughly half the baryons in the Universe, all hiding in the Web.”
“Concealment by dispersal, got it. What’s another technique?”
“Camouflage. No, not tiny uniforms in a woodland pattern. These atoms fade into the background because oncoming light waves pass right by them unless the wave has exactly the right wavelength for an absorption.”
“So how did astronomers detect these scattered and camouflaged atoms?”
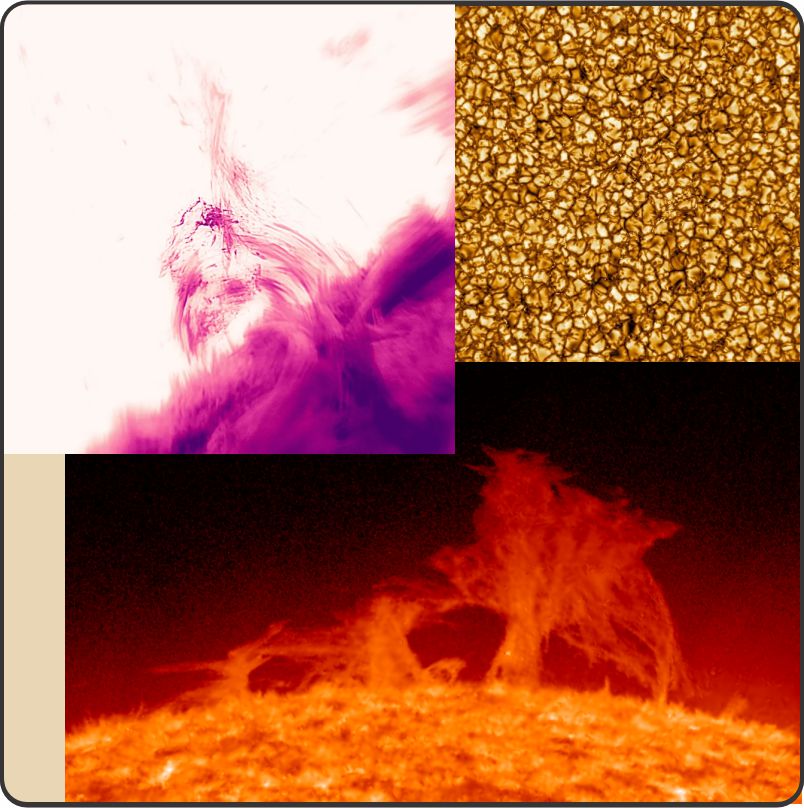
“A couple of different ways. X‑rays, for one.”
“But these atoms are camouflaged against passing light. X‑rays are light waves.”
“X‑rays the atoms emit. Everybody thinks that space is cold, but those lonely atoms bounce around with a kinetic energy equivalent to million‑degree temperatures. When two of them collide some of that kinetic energy escapes as high‑frequency light, X‑ray range. Not a whole lot, because the atoms are sparse, but enough that European and Japanese space telescopes were able to tweeze it out of the background.”
“Use sensitive mics to pick up whispered convo in the opposing line.”
<pause> “Right, more or less. What do you know about refraction?”
“Mmm… Newton and his prism, splitting white light into different colors. I’ve no idea how that works.”
“The short answer is that the speed of light depends on its wavelength and the medium it’s traversing. In a perfect vacuum, light always goes at top speed just like Einstein said, but charged particles in its path slow it down.”
“Even those atoms in space that you said can’t absorb light?”
“Yup. It’s called virtual coupling; quantum’s involved. One inaccurate way to describe the interaction is that atoms occasionally absorb wrong‑wavelength photons but spit them right back out again after a brief delay. Short wavelengths see more of that effect than long wavelengths do. With me?”
<pause> “Go on.”
“Does the phrase ‘Fast Radio Burst’ sound familiar?”
“Of course, but probably not the way you mean.”
“Ah. Right. For this context, Fast Radio Bursts are isolated pulses of radio‑frequency light from incredibly bright extra-galactic sources we don’t understand. They’re all over the sky. A pulse lasts only a millisecond or so. What’s important here is that refraction skews each pulse’s wavelength profile as it travels through the intergalactic medium. Researchers analyze the distortions to detect and characterize Web filaments in the direction each pulse came from.”
“Intercept the oppo’s communications to the front.”
“That’s about the size of it.”
“Bye.”
“Don’t mention it.”
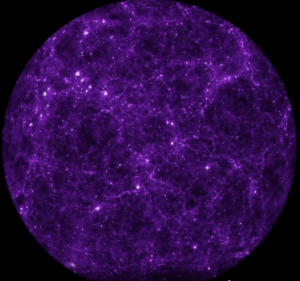
Visualization: Frank Summers (STScI); Simulation: Martin White and Lars Hernquist, Harvard University
~ Rich Olcott


_as_of_January_20,_2020.jpg)