
The Acme Building Science and Pizza Society is back in session. It’s Cal’s turn to deal the cards and the topic. “This TV guy was talking about rare earths that China’s got a lock on and it’s gonna mess up our economy, but he didn’t say what they are or why we should care about them. What’s goin’ on?”
Vinnie passes but Susan tosses a chip into the pot. “The rare earths are oxides of the lanthanide elements—”
“Wait, they’re from the planet that the Strange New Worlds engineering prof is from?”
“Put in a chip, Vinnie, you know the rules.” <He does.> “No, they have nothing to do with Pelia or her home planet. She’s a Lanthanite, these elements are lanthanides. Although these days we’re supposed to call them lanthanoids because ‑ides are ionic compounds like oxides.”
It’s not Kareem’s turn yet but he chuckles and flips in a chip. “Funny. The geology community settled on meteoroids as rocks floating in space, meteors when they flash through the sky, and meteorites when they hit the ground. I don’t think there’s such a thing as a meteoride. Sorry, Susan, go on.”
“As a matter of fact, Kareem, I once did a high‑rated downhill mountain bike path in Arizona called the Meteoride. Once. Didn’t wipe out but I admit I used my brakes a whole lot. Where was I? Oh, yes, the lanthanides. They’re a set of fourteen near‑identical twins, chemistry so similar that it took decades of heroic effort by 19th‑century Swedish chemists in the long, cold Swedish nights to separate and identify them.”
“Similar how?”
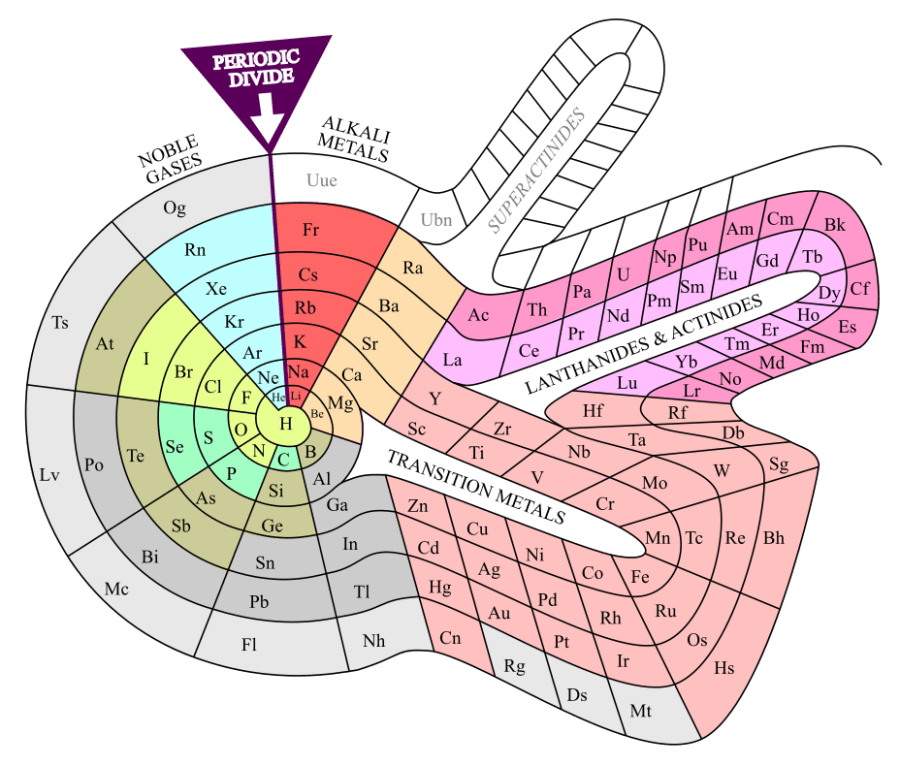
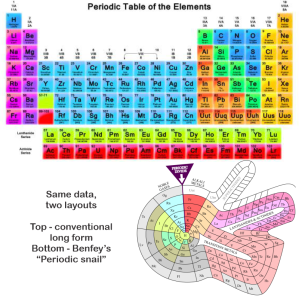
“They all act like aluminum.” <pulls laptop from her purse, points to two stickers on its lid> “You’ve all at least heard of the Periodic Table, right? Back in the mid-1800s, the chemists had isolated dozens of chemical elements, enough that they could start classifying them. They didn’t know what atoms were yet but they had developed ways to measure average atomic weights. Some theorists played with the idea of arranging elements with similar chemistries according to their atomic weights. Mendeleev did the best job, even predicting three elements to fill empty slots in his tabulation. These guys in the lime green row and the pale pink bulge were his biggest puzzlement.”
“Why’s that? They’re all spread out nice.”
“Because like I said, Vinnie, they all have pretty much the same chemistry. Aluminum’s a soft silvery metal, oxidizes readily to a 3+ ion and stays there. Same for almost all the lanthanides. Worse yet, all their atoms are nearly the same size, less than 8% difference from the largest to the smallest.”
“Why’s that make a difference?”
“Because they can all fit into the same crystalline structure. Nineteenth‑century chemistry’s primary technique for isolating a metallic element was to dissolve a likely‑looking ore, purify the solution, add an organic acid or something to make crystalline salts, burn away the organics, add more acid to dissolve the ash, purify the solution and re‑crystallize most it. Do that again and again until you have a provably pure product. All the lanthanide ions have the same charge and nearly the same size so the wrong ions could maliciously infiltrate your crystals. It took a lot of ingenious purification steps to isolate each element. There were many false claims.”
Kareem contributes another chip. “Mm‑hm, because geology doesn’t use chemically pure materials to create its ores. Four billion years ago when our planet was coated with molten magma, the asteroids striking Earth in the Late Heavy Bombardment brought megatons of stone‑making lithophile elements. The lanthanides are lithophiles so random mixtures of them tended to concentrate within lithic silicate and phosphate blobs that later cooled to form rocky ores. Industry‑scale operations can tease lanthanides out of ores but the processes use fierce chemicals and require close control of temperature and acidity. Tricky procedures that the Chinese spent billions and decades to get right. For the Chinese, those processes are precious national security assets.”
Cal’s getting impatient. “Hey, guys, are we playing cards or what?”
~ Rich Olcott


.svg)
_as_of_January_20,_2020.jpg)