Shapes And Numbers

I’m nursing my usual mug of eye‑opener in Cal’s Coffee Shop when astronomer Cathleen and chemist Susan chatter in and head for my table. Susan fires the first volley.

“Sy, those spherical harmonics you’ve posted don’t look anything like the atomic orbitals in my Chem text. Shouldn’t they?”
 ”How do you add and multiply shapes together?”
  ”What does the result even mean?”
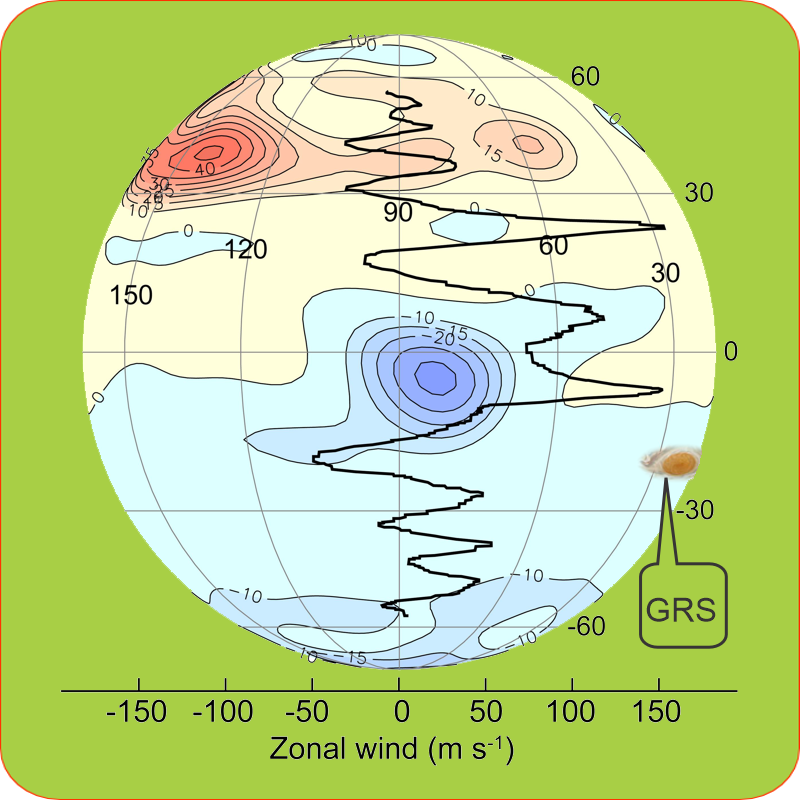
   ”And what was that about solar seismology?”

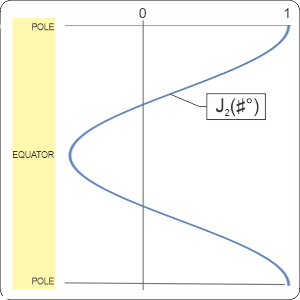
“Whoa, have you guys taken interrogation lessons from Mr Feder? One at a time, please. Let’s start with the basics.” <sketching on a paper napkin> “For example, the J2 zonal harmonic depends only on the latitude, not on the longitude or the distance from the center, so whatever it does encircles the axis. Starting at the north pole and swinging down to the south pole, the blue line shows how J2 varies from 1.0 down to some negative decimal. At any latitude, whatever else is going on will be multiplied by the local value of J2.”

“The maximum is 1.0, huh? Something multiplied by a number less than 1 becomes even smaller. But what happens where J2 is zero? Or goes negative?”

“Wherever Jn‘s zero you’re multiplying by zero which makes that location a node. Furthermore, the zero extends along its latitude all around the sphere so the node’s a ring. J2‘s negative value range does just what you’d expect it to — multiply by the magnitude but flip the product’s sign. No real problem with that, but can you see the problem in drawing a polar graph of it?”

“Sure. The radius in a polar graph starts from zero at the center. A negative radius wouldn’t make sense mixed in with positives in the opposite direction.”

“Well it can, Cathleen, but you need to label it properly, make the negative region a different color or something. There are other ways to handle the problem. The most common is to square everything.” <another paper napkin> “That makes all the values positive.”

“But squaring a magnitude less than 1 makes it an even smaller multiplier.”

“That does distort the shapes a bit but it has absolutely no effect on where the nodes are. ’Nothin’ times nothin’ is nothin’,’ like the song says. Many of the Chem text orbital illustrations I’ve seen emphasize the peaks and nodes. That’s exactly what you’d get from a square‑everything approach. Makes sense in a quantum context, because the squared functions model electron charge distributions.”

“Thanks for the nod, Sy. We chemists care about charge peaks and nodes around atoms because they control molecular structures. Chemical bonds and reactions tend to localize near those places.”

“I aim for fairness, Susan. There is another way to handle a negative radius but it needs more context to look reasonable. Meanwhile, we’ve established that at any given latitude each Jn is just a number so let’s look at longitudes.” <a third paper napkin> “Here’s the first two sectorial harmonics plotted out in linear coordinates.”

“Looks familiar.”

“Mm‑hm. Similar principles, except that we’re looking at a full circle and the value at 360° must match the value at 0°. That’s why Cm always has an even node count — with an odd number you’d have -1 facing +1 and that’s not stable. In polar coordinates,” <the fourth paper napkin> “it’s like you’re looking down at the north pole. C0 says ‘no directional dependence,’ but C1 plays favorites. By the way, see how C1‘s negative radii in the 90°‑270° range flip direction to cover up the positives?”

“Ah, I see where you’re going, Sy. Each of these harmonics has a numeric value at each angle around the center. You’re going to tell us that we can multiply the shapes by multiplying their values point by point, one for each latitude for a J and each longitude for a C.”

“You’re way ahead of me as usual, Cathleen. You with us, Susan?”

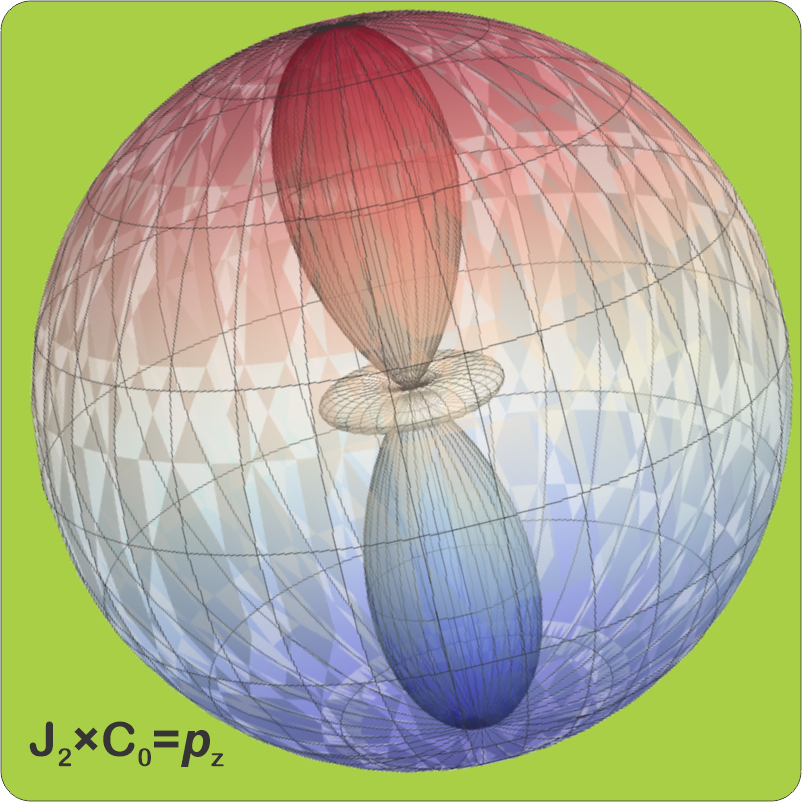
“Oh, yes. In my head I multiplied your J2 by C0 and got a pz orbital.”

“I’m impressed.”
 ”Me, too.”

“Oh, I didn’t do it numerically. I just followed the nodes. J2 has two latitude nodes, C0 has no longitude nodes. There it is, easy‑peasy.”

~~ Rich Olcott

Sectorial Setbacks

<chirp, chirp> “Moire here.”

“Moire, you were holding out on me. Eddie’s, fifteen minutes.”

“Not so fast, Walt. That wasn’t me holding out, that was you leaving too soon. From now on you’re paying quite a bit more. And it’ll be thirty minutes.”

“So we’re negotiating, hmm?”

“That’s about the size of it. You still interested?”

“My people are, they sent me back here. Oh well. Thirty minutes.”


Thirty-three minutes later I walk into Eddie’s. Walt’s already gotten a table. He beckons, points to the freshly‑served pizza, raises an eyebrow.

“Apology accepted. What made your people unhappy?”

“You told me flat‑out that the Sun’s gravity couldn’t affect those zonal harmonics. Do you have anything to back that up?”

“Symmetry. Zonal harmonics and latitude are about north‑south. Each Jn is a pole‑to‑pole variation pattern. The only way solar gravity can tilt Jupiter’s north‑south axis is to exert torque along the zonal harmonics. Jupiter’s equator is within 3° of edge‑on to the Sun.” <showing an image on Old Reliable’s screen> “Here’s what the Sun sees looking at J10, for instance. Solar pull on any northern zone segment, say, would be counteracted by an equal pull on the corresponding southern segment of the same zone. No net torque, no tilt. J0‘s the only exception. It’s simply a sphere that doesn’t vary across the whole planet. The Sun’s pull along J0‘s arc can’t tilt Jupiter.”

“Okay, so the zonal picture’s too simple. Just one set of waves, running up and down the planet—”

“No, not running. One way to characterize a wave is by how its components change with time. You’re thinking like ocean waves that move from place to place as time goes by. There’s also standing waves like on a guitar string, where individual points move but the peaks and valleys don’t. There’s time‑only waves like how the day length here changes through the year. And there’s static waves where time’s not even in the equation. Jupiter’s stripes don’t move, they’re peaks and valleys in a static wave pattern. By definition, the zonal harmonic system is static like that. But you’re right, it’s only part of the picture.”

“Give me the part the Sun’s gravitational field does play with.”

“That’d be two parts — sectorial and radial harmonics. Sectorial is zonal’s perpendicular twin. Zonal wave patterns show variation along the polar axis; sectorial wave patterns Cm vary around it. I’m keeping it non‑technical for you but Cm‘s actually cos(m*x) where x is the longitude.”

“Just don’t let it go any farther.”

“I’ll try not to. My point is that each sector pattern can be labeled with a positive integer just like we did with the zones.”

“If the Jn arcs aren’t affected by solar gravity, why would I care about these Cms?”

“You wouldn’t, except for the fact that mass distribution across Jupiter’s sectors is probably lumpy. We know the Great Red Spot holds its position in the southern hemisphere and the planet’s magnetic field points way off to the side. Maybe those features mark off‑center mass deficits and concentrations. Suppose a particular sectorial wave’s peak sits directly over a mass lump or hole. Everything under that harmonic’s influence is tugged back and forth by solar gravity each time the wave traverses the day side. Juno in its N‑S path just isn’t an efficient sensor for those tugs. Good sectorial sensing would require an orbiter on an E‑W path, preferably right over the equator.  Any orbital wobbles we’d see could be fed into a sectorial gravity map. Cross that with the zonal map and we’d be able to locate underlying mass variations by latitude and longitude.”

“Not a good idea. Gravity’s not the only field in play. You’ve just mentioned Jupiter’s magnetic field. I’ve read it’s stronger than any other planet’s. If your E‑W orbiter’s built with even a small amount of iron, you’d have a hard time deciding which field was responsible for any observed irregularities.”

“Good point. The idea’s even worse than you think, though. Jupiter’s sulfur‑coated moon—”

“Io. Yes, your induction‑heating idea might even be real. What about it?”

“I haven’t written yet about the high‑voltage Io‑to‑Jupiter bridge made of sulfur, oxygen and hydrogen ions. Jupiter’s magnetism plays a complicated game with them but the result is a chaotic sheet of radiating plasma around the planet’s equator. An E‑W orbiter in there would be tossed about like a paper boat on the ocean.”

~~ Rich Olcott

Screaming Out Of Space

Cal (formerly known as Al) comes over to our table in his coffee shop. “Lessee if I got this right. Cathleen is smug twice. First time because the new results from Juno‘s data say her hunch is right that Jupiter’s atmosphere moves like cylinders inside each other. Nearly cylinders, anyhow. Second smug because Sy used the Juno data to draw a math picture he says shows the Great Red Spot but I’m lookin’ at it and I don’t see how your wiggle‑waggles show a Spot. That’s a weird map, so why’re you smug about it, Cathleen?”

“The map’s weird because it’s abstract and way different from the maps you’re used to. It’s also weird because of how the data was collected. Sy, you tell him about the arcs.”

“Okay. Umm… Cal, the maps you’re familiar with are two‑dimensional. City maps show you north‑south and east‑west, that’s one dimension for each direction pair. Maps for bigger‑scale territories use latitude for north‑south and longitude for east‑west but the principle’s the same. The Kaspi group’s calculations from Juno‘s orbit data give us a recipe for only a one‑dimensional map. They show how Jupiter’s gravity varies by latitude, nothing about longitude. We could plot that as a rectangle, latitude along the x‑axis, relative strength along the y‑axis. I thought I’d learn more by wrapping the x‑axis around the planet so we could look for correlations with Jupiter’s geography. I found something and that’s why Cathleen’s smug. Me, too.”

“Why latitude but nothing about longitude?”

“Because of the way Juno‘s orbit works. The spacecraft’s not hovering over the planet or even circling it like the ISS circles Earth. NASA wanted to minimize Juno‘s exposure to Jupiter’s intense magnetic and radiation fields. The craft spends most of its 53‑day orbit at extreme distance, up to millions of kilometers out. When it approaches, it screams in at about 41 kilometers per second, that’s 91 700 mph, on a mostly north‑to‑south vector so it sees all latitudes from a few thousand kilometers above the cloud‑tops. Close approach lasts only about three hours, for the whole planet, and then the thing is on its way out again. During that three hours, the planet rotates about 120° underneath Juno so we don’t have a straight vertical N‑S pass down the planet’s face. Gathering useful longitude data’s going to take a lot more orbits.”

“So you’re sayin’ Juno felt gravity glitches at all different angles going pole to pole, but only some of the angles going round and round.”

“Exactly.”

“So now explain the wiggle‑waggles.”

“They represent parts‑per‑million variations in the field pulling Juno towards Jupiter at each latitude. Where the craft is over a more massive region it’s pulled a bit inwards and Sy’s map shows that as a green bump. Over a lighter region Juno‘s free to move outward a little and the map shows a pink dip. Kaspi and company interpret the heaviness just north of the equator to be a dense inward flow of gas all around the planet. Maybe it is. Sy and I think the pink droplet south of the equator could reflect the Great Red Spot lowering the average mass at its latitude. Maybe it is. As always, we need more data, okay? Now I’ve got questions for you, Sy.”

“Shoot.”

“You built your map by multiplying each Jn‑shape by its Kaspi gravitational intensity then adding the multiplied shapes together. But you only used Jn‑shapes with integer names. Is there a J½?”

“Some mathematicians play with fractional J‑thingies but I’ve not followed that topic.”

“Understandable. Next question — the J‘s look so much like sine waves. Why not just use sine‑shapes?”

“I used Jn‑shapes because that’s how Kaspi’s group stated their results. They had no choice in the matter. Jn‑shapes naturally appear in spherical system math. The nice thing about Jn‑shapes is that n provides a sort of wavelength scale. For instance, J35 divides Jupiter’s pole‑to‑pole arc into 36 segments each as wide as Earth’s diameter. Here’s a plot of intensity against n.”

Adapted from Kaspi, Figure 2a

“Left to right, red light to blue.”

“Exactly.”

~ Rich Olcott

Red And Blue Enigmas

“All that cloud stuff goes on in Jupiter’s tissue-paper outer layer. What’s the rest of the planet doing, Cathleen?”

“You’re not going to like this, Vinnie, but all we’ve got so far is broad‑brush averages. The Galileo atmosphere probe penetrated less than 0.2% of the way to the center. The good news is that the Juno probe has been sending us oodles of data about Jupiter’s gravity and magnetic fields. That’s great for planet‑wide theorizing, not quite as useful for weather prediction.”

“Can the data explain the Great Red Spot?”

“Well, it ruled out some ideas. Back in the day we thought the Spot was a deep whirlpool opening a view into the interior. Nope. Juno‘s measurements revealed that the Spot is actually a dome rising hundreds of kilometers above the white cloud‑tops. When one window closes, another one opens, I suppose. The fact that the Spot’s a dome says down below there’s an immense energy source lifting the gases above it. We don’t know what it is or why it’s there or how for two centuries it’s mostly held position in a completely fluid environment.”

“Weird. You’d expect something like that at a special location, like at one of the poles, but the Spot isn’t even on the planet’s equator.”

“Right, Sy. Its latitude is 22° south.”

“Hey, that’s the Tropic of Capricorn.”

“Almost, Vinnie, but not relevant. Earth’s two Tropics are at 23½° north and south. If the Earth’s rotational axis were perpendicular to its solar orbit, the Sun’s highest position would always be directly over the Equator. But Earth’s axis is tilted at 23½° to our orbital plane. To see the noon Sun at the zenith you’d have to be 23½° north of the Equator in June, 23½° south of the Equator in December. Jupiter’s rotational axis is tilted, too, but by only 3°. That rules out significant seasonality on Jupiter, but it also says that on Jupiter there’s nothing special about 22° except that it’s where the Spot hangs out.”

“How about longitude?”

“Longitude on Jupiter is an embarrassing topic. Zero longitude on Earth, our Prime Meridian, runs through Greenwich Observatory in London, right? I don’t want to get into the history behind that. On a completely gaseous planet like Jupiter, there’s no stable physical object to tag with a zero. Jupiter’s cloud‑tops rotate faster near its equator than at its poles. Neither rotation syncs with Jupiter’s magnetic field which is like Earth’s except it’s much more intense and it points in the opposite direction. Oh, and it’s offset from the center of the planet and it’s lumpy. For lack of a better alternative, astronomers arbitrarily thumbtacked Jupiter’s Prime Meridian to its magnetic field. They selected the magnetic longitudinal line that pointed directly towards Earth at a particular moment in 1965. Given a good clock and the field’s rate of rotation you can calculate where that line will be at any other time.”

“Sounds like that ephemeris strategy Sy told me about in our elevator adventure. Why’s that embarrassing?”

“Well, back in 1965 the tool of choice for studying Jupiter’s rotating magnetic field was radio spectroscopy. Technology wasn’t as good as we have now and they … didn’t get a completely accurate rate of rotation. We’re stuck with a standard coordinate system where the Prime Meridian slips about 3° every year relative to the magnetic field. Even the Great Red Spot slips a little.”

“Cathleen, I’ve read that Juno uncovered a region of particularly intense magnetic activity they’re calling Jupiter’s Great Blue Spot. Does it have any connection to the Red Spot?”

Magnetism and wind map by NASA/JPL-Caltech/SwRI/John E. Connerney. Great Red Spot image added by the author.

“Probably not, Sy, the Red Spot’s 15° south and 60° east of the Blue. But with Jupiter who knows?”

“Got any other interesting averages?”

“Extreme wind speeds. There’s a jet stream between each pair of Jupiter’s stripes, eastbound on the poleward side of a white zone, westbound in the other side. Look at the zig‑zag graph on this chart. 75 meters/second is 167 miles per hour is a Category 5 hurricane here on Earth. At latitudes near Jupiter’s equator average winds are double that.”

~~ Rich Olcott