Zarzuela for Rubber Ruler

“Hey, Cathleen, if the expansion of the Universe stretches light’s wavelengths, how do you know when you see a color in a star what you’re looking at?”

“Excuse me, Professor, but your office-mate said you’d be here at the coffee shop and I have a homework question.”

“Good heavens, look at the time!  It’s my office hours, I should be over there.  Oh well, you’re here, Maria, what’s the question?”

“You showed us this chart and asked us to write an essay on it.  I don’t know where to begin.”Temp and BB peak

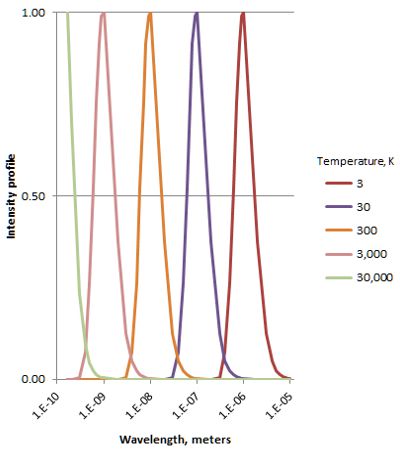
“Ah.  Hang on, Vinnie, this bears on your question, too.  OK, Maria, what can you tell me about the chart?”

“Well, there are five peaked curves, labeled with different temperatures.  Can I assume the green curve peaks, too, not continuing straight up?”

“Yes.  What else?”

“The horizontal axis, sorry I don’t know the word —”

“abscissa”

“Oh, we have almost the same word in Spanish!  Anyhow, the abscisa says it shows wavelengths.  It goes from a tenth of a nanometer to maybe 10 micrometers.  The chart must have to do with light, because sound waves can’t get that short.  The … ordinada…?”

“Ordinate”

“Thank you.  The ordinate says ‘Intensity’ so the chart must show light spectra at different temperatures.  But there’s only one peak at each temperature.”

“Is that Kirchhoff’s ‘continuous spectrum,’ Cathleen?”

“Right, Vinnie, a smoothly-varying cascade of every wavelength, photons arising from heat-generated motion of charged particles.”

Ah, ya lo veo — this is blackbody spectra given off by hot objects.  You showed us one in class and here we have several.”

“Good, Maria.  Now —”

“But all the peaks look exactly the same, Cathleen.  The hot objects ought to be brighter.  A really hot flame, you can’t even look at it.  Something’s phony.”

“Good eye, Vinnie.  I divided each curve in the graph by its peak height to put them all on an even footing.  That’s why the axis is labeled ‘Intensity profile‘ instead of ‘Intensity.'”

“I’ve got a different issue, Cathleen.  Hot objects have more energy to play with.  Shouldn’t the hotter peaks spread over a wider wavelength range?  These are all the same width.”

“I think I know the answer to that one, Mr Moire.  In class la profesora showed us how the blackbody curve’s equation has two factors, like B=W*X.  The W factor depends only on wavelength and grows bigger as the wavelength gets smaller.  That’s the ‘ultraviolet catastrophe,’ right, ma’am?”

“Mm-hm.  Go on, Maria.”

“But the X factor gets small real fast as the wavelength gets small.  In fact, it gets small so fast that it overpowers W‘s growth — the W*X product gets small, too.  Do you have that movie you showed us on your laptop there, ma’am?”

“Sure.  Here it is…”Blackbody peaks 1

“OK, the blue line is that W factor.  Oh, by the way, the ordinate scale here is logarithmic, so the value at the left end of the blue line is 1027/106 or about 1021 times bigger than it is at the right end even though it looks like a straight line.  The green line is that temperature-dependent factor.  See how it pulls down the orange lines’ values for cold objects, but practically goes away for very hot objects?”

“Yeah, that shows it real good, right, Sy?  That orange peak moves to the left just like Cathleen’s picture shows.  It answers your question, too.”

“It does, Vinnie?  How so?”

“‘Cause the peaks get broader as they get higher.  It’s like the intensity at the, umm, microwave end hardly changes at all and the whole rest of the curve swings up and out from there.”

“Keep in mind, guys, that we’re talking really large numbers here.  Vinnie’s ‘hardly changes at all’ is actually a factor of 40,000 or so.  Those pretty peaks in my homework chart are only pretty because the spread-out tails are so small relative to the peaks.”

“Alright, Cathleen, but how does Maria’s question tie in with mine?”

“They both hinge on wavelength.  The blackbody equation lets us measure a star’s temperature by looking at its color.  Do you have enough to start on that essay, Maria?”

“Yes, ma’am.  Gracias.”

De nada.  Now run along and get to work on it.”

~~ Rich Olcott

Trio for Rubber Ruler

“It’s all about how lightwaves get generated and then what happens.”

Sy and me talked about that, Cathleen.  Lightwaves come from jiggling electrons, right?”

“Any kind of charged particles, Vinnie, but there’s different ways that can happen.  Each leads to its own kind of spectrum.”

“Different kinds of spectrum?  Do you mean like visible versus infrared and ultraviolet, Cathleen?”

“No, I don’t, Sy.  I’m referring to the thing’s overall appearance in every band.  A hundred and fifty years ago Kirchoff pointed out that light from a source can have lines of color, lines without color, or a smooth display without lines.”

“Like that poster that Al put up between the physicist and astronomer corners?”  (We’re still chatting at a table in Al’s coffee shop.  I’m on my fourth scone.)

Astroruler with solar spectrum
Based on N.A.Sharp, NOAO/NSO/Kitt Peak FTS/AURA/NSF

“Kind of.  That’s based on a famous image created at Kitt Peak Observatory.  In the background there you see a representation of what Kirchoff called a continuous or black-body spectrum, where all the colors fade smoothly into each other in classic rainbow order.  You’re supposed to ignore the horizontal dark lines.”

“And the vertical lines?”

“They form what Kirchoff called an absorption spectrum.  Each dark vertical represents an isolated color that we don’t get from the Sun.”

“You’re saying we get all the other colors but them, right?”

“Exactly, Vinnie.  The Sun’s chromosphere layer filters those specific wavelengths before they get from the deeper photosphere out into space.”

“Complicated filter.”

“Of course.  The Sun contains most of the elements lighter than nickel.  Each kind of atom absorbs its own collection of frequencies.”

“Ah, that’s the quantum thing that Sy and me talked about, right, Sy?”

“Mm-hm.  We only did the hydrogen atom, but the same principles apply.  An electromagnetic wave tickles an atom.  If the wave delivers exactly the right amount of energy, the atom’s chaotic storm of electrons resonates with the energy and goes a different-shaped storm.  But each kind of atom has a limited set of shapes.  If the energy doesn’t match the energy difference between a pair of levels, there’s no absorption and the wave just passes by.”

“But I’ll bet the atom can’t hold that extra energy forever.”

“Good bet, Vinnie.  The flip side of absorption is emission.  I expect that Cathleen has an emission spectrum somewhere on her laptop there.”Emission spectrum
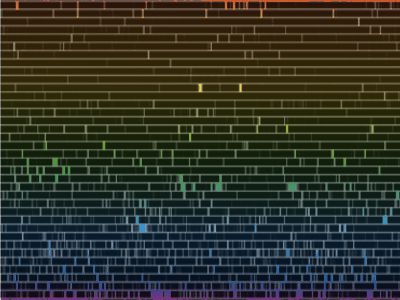
“You’re right, Sy.  It’s not a particularly pretty picture, but it shows that nice strong sodium doublet in the yellow and the broad iron and hydrogen lines down in the green and blue.  I’ll admit it, Vinnie, this is a faked image I made to show my students what the solar atmosphere would look like if you could turn off the photosphere’s continuous blast of light.  The point is that the atoms emit exactly the same sets of colors that they absorb.”

“You do what you gotta do, Cathleen.  But tell me, if each kind of atom does only certain colors, where’s that continuous rainbow come from?  Why aren’t we only getting hydrogen colors?”

“Kirchoff didn’t have a clue on that, Vinnie.  It took 50 years and Einstein to solve it.  Not just where the light comes from but also its energy-wavelength profile.”

“So where does the light come from?”

“Pure heat.  You can get a continuous spectrum from a hot wire, molten lava, a hole through the wall of a hot oven, even the primordial chaos of the Big Bang.  It doesn’t matter what kind of matter you’re looking at, the profile just depends on the temperature.  You know that temperature measures the kinetic energy stored in particle random motion, Vinnie?”

“Well, I wouldn’t have put it that way, but yeah.”

“Well, think about the Sun, just a big ball of really hot atoms and electrons and nuclei, all bouncing off each other in frantic motion.  Every time one of those changes direction it affects the electromagnetic field, jiggles it as you say.  The result of all that jiggling is the continuous spectrum.  Absorption and emission lines come from electrons that are confined to an atom, but heat motion is unconfined.”

“How about hot metal?”

“The atoms are locked in their lattice, but heat jiggles the whole lattice.”

~~ Rich Olcott

Étude for A Rubber Ruler

93% redder?  How do you figure that, Sy, and what’s it even mean?”

“Simple arithmetic, Vinnie.  Cathleen said that most-distant galaxy is 13 billion lightyears away.  I primed Old Reliable with Hubble’s Constant to turn that distance into expansion velocity and compare it with lightspeed.  Here’s what came up on its screen.”Old Reliable z calculation“Whoa, Sy.  Do you read the final chapter of a mystery story before you begin the book?”

“Of course not, Cathleen.  That way you don’t know the players and you miss what the clues mean.”

“Which is the second of Vinnie’s questions.  Let’s take it a step at a time.  I’m sure that’ll make Vinnie happier.”

“It sure will.  First step — what’s a parsec?”

“Just another distance unit, like a mile or kilometer but much bigger.  You know that a lightyear is the distance light travels in an Earth year, right?”

“Right, it’s some huge number of miles.”

“About six trillion miles, 9½ trillion kilometers.  Multiply the kilometers by 3.26 to get parsecs.  And no, I’m not going to explain the term, you can look it up.  Astronomers like the unit, other people put it in the historical-interest category with roods and firkins.”

“Is that weird ‘km/sec/Mparsec’ mix another historical thing?”

“Uh-huh.  That’s the way Hubble wrote it in 1929.  It makes more sense if you look at it piecewise.  It says for every million parsecs away from us, the outward speed of things in general increases by 70 kilometers per second.”

“That helps, but it mixes old and new units like saying miles per hour per kilometer.  Ugly.  It’d be prettier if you kept all one system, like (pokes at smartphone screen) … about 2.27 km/sec per 1018 kilometers or … about 8 miles an hour per quadrillion miles.  Which ain’t much now that I look at it.”

“Not much, except it adds up over astronomical distances.  The Andromeda galaxy, for instance, is 15×1018 miles away from us, so by your numbers it’d be moving away from us at 120,000 miles per hour.”

“Wait, Cathleen, I thought Andromeda is going to collide with the Milky Way four billion years from now.”

Opposing motion in a starfield“It is, Sy, and that’s one of the reasons why Hubble’s original number was so far off.  He only looked at about 50 close-by galaxies, some of which are moving toward us and some away.  You only get a view of the general movement when you look at large numbers of galaxies at long distances.  It’s like looking through a window at a snowfall.  If you concentrate on individual flakes you often see one flying upward, even though the fall as a whole is downward.  Andromeda’s 250,000 mph march towards us is against the general expansion.”

“Like if I’m flying a plane and the airspeed indicator says I’m doing 200 but my ground-speed is about 140 then I must be fighting a 60-knot headwind.”

“Exactly, Vinnie.  For Andromeda the ‘headwind’ is the Hubble Flow, that general outward trend.  If Sy’s calculation were valid, which it’s not, then that galaxy 13 billion lightyears from here would indeed be moving further away at  93% of lightspeed.  Someone living in that galaxy could shine a 520-nanometer green laser at us.  At this end we see the beam stretched by 193% to 1000nm.  That’s outside the visible range, well into the near-infrared.  All four visible lines in the hydrogen spectrum would be out there, too.”

“So that’s why ‘old hydrogens’ look different — if they’re far enough away in the Hubble Flow they’re flying away from us so fast all their colors get stretched by the red-shift.”

“Right, Vinnie.”

“Wait, Cathleen, what’s wrong with my calculation?”

“Two things, Sy.  Because the velocities are close to lightspeed, you need to apply a relativistic correction factor.  That velocity ratio Old Reliable reported — call it b.  The proper stretch factor is z=√ [(1+b)/(1–b)].  Relativity takes your 93% stretch down to (taps on laptop keyboard) … about 86%.  The bluest wavelength on hydrogen’s second-down series would be just barely visible in the red at 680nm.”

“What’s the other thing?”Ruler in perspective

“The Hubble Constant can’t be constant.  Suppose you run the movie backwards.  The Universe shrinks steadily at 70 km/sec/Mparsec.  You hit zero hundreds of millions of years before the Big Bang.”

“The expansion must have started slow and then accelerated.”

“Vaster and faster, eh?”

“Funny, Sy.”

~~ Rich Olcott

Toccata for A Rubber Ruler

“How the heck do they know that?”

“Know what, Vinnie?”

“That the galaxy they saw with that gravitational lens is 13 billion years old?  I mean, does it come with a birth certificate, Cathleen?”

“Mm, it does, sort of — hydrogen atoms.  Really old hydrogen atoms.”

“Waitaminit.  Hydrogen’s hydrogen — one proton, one electron per atom.  They’re all the same, right?  How do you know one’s older than another one?”

“Because they look different.”

“How could they look different when they’re all the same?”

“Let me guess, Cathleen.  These old hydrogens, are they far far away?”

“On the button, Sy.”

“What where they’re at got to do with it?”

“It’s all about spectroscopy and the Hubble constant, Vinnie.  What do you know about Edwin Hubble?”

“Like in Hubble Space Telescope?  Not much.”

“Those old atoms were Hubble’s second big discovery.”

“Your gonna start with the other one, right?”

“Sorry, classroom habit.  His first big discovery was that there’s more to the Universe than just the Milky Way Galaxy.  That directly contradicted Astronomy’s Big Names.  They all believed that the cloudy bits they saw in the sky were nebulae within our galaxy.  Hubble’s edge was that he had access to Wilson Observatory’s 100-inch telescope that dwarfed the smaller instruments that everyone else was using.  Bigger scope, more light-gathering power, better resolution.”

“Hubble won.”

“Yeah, but how he won was the key to his other big discovery.  The crucial question was, how far away are those ‘nebulae’?  He needed a link between distance and something he could measure directly.  Stellar brightness was the obvious choice.  Not the brightness we see on Earth but the brightness we’d see if we were some standard distance away from it.  Fortunately, a dozen years earlier Henrietta Swan Leavitt found that link.  Some stars periodically swing bright, then dim, then bright again.  She showed that for one subgroup of those stars, there’s a simple relationship between the star’s intrinsic brightness and its peak-to-peak time.”Astroruler

“So Hubble found stars like that in those nebulas or galaxies or whatever?”

“Exactly.  With his best-of-breed telescope he could pick out individual variable stars in close-by galaxies.  Their fluctuation gave him intrinsic brightness.  The brightness he measured from Earth was a lot less.  The brightness ratios gave him distances.  They were a lot bigger than everyone thought.”

“Ah, so now he’s got a handle on distance.  Scientists love to plot everything against everything, just to see, so I’ll bet he plotted something against distance and hit jackpot.”

“Well, he was a bit less random than that, Sy.  There were some theoretical reasons to think that the Universe might be expanding.  The question was, how fast?  For that he tapped another astronomer’s results.  Vesto Slipher at Lowell Observatory was looking at the colors of light emitted by different galaxies.  None had light exactly like our Milky Way’s.  A few were a bit bluer, but most were distinctly red-shifted.”

“Like the Doppler effect in radar?  Things coming toward you blue-shift the radar beam, things going away red-shift it?”

“Similar to that, Vinnie, but it’s emitted light, not a reflected beam. To a good approximation, though, you can say that the red shift is proportional to the emitting object’s speed towards or away from us.  Hubble plotted his distance number for each galaxy he’d worked on, against Slipher’s red-shift speed number for the same galaxy.  It wasn’t the prettiest graph you’ve ever seen, but there was a pretty good correlation.  Hubble drew the best straight line he could through the points.  What’s important is that the line sloped upward.”

“Lemme think … If everything just sits there, there’d be no red-shift and no graph, right?  If everything is moving away from us at a steady speed, then the line would be flat — zero slope.  But he saw an upward slope, so the farther something is the faster it’s going further from us?”

“Bravo, Vinnie.  That’s the expansion of the Universe you’ve heard about.  Locally there are a few things coming toward us — that’s those blue-shifted galaxies, for instance — but the general trend is away.”

“So that’s why you say those far-away hydrogens look different.  By the time we see their light it’s been red-shifted.”

“93% redder.”

~~ Rich Olcott