“93% redder? How do you figure that, Sy, and what’s it even mean?”
“Simple arithmetic, Vinnie. Cathleen said that most-distant galaxy is 13 billion lightyears away. I primed Old Reliable with Hubble’s Constant to turn that distance into expansion velocity and compare it with lightspeed. Here’s what came up on its screen.”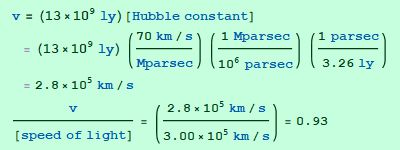 “Whoa, Sy. Do you read the final chapter of a mystery story before you begin the book?”
“Of course not, Cathleen. That way you don’t know the players and you miss what the clues mean.”
“Which is the second of Vinnie’s questions. Let’s take it a step at a time. I’m sure that’ll make Vinnie happier.”
“It sure will. First step — what’s a parsec?”
“Just another distance unit, like a mile or kilometer but much bigger. You know that a lightyear is the distance light travels in an Earth year, right?”
“Right, it’s some huge number of miles.”
“About six trillion miles, 9½ trillion kilometers. Multiply the kilometers by 3.26 to get parsecs. And no, I’m not going to explain the term, you can look it up. Astronomers like the unit, other people put it in the historical-interest category with roods and firkins.”
“Is that weird ‘km/sec/Mparsec’ mix another historical thing?”
“Uh-huh. That’s the way Hubble wrote it in 1929. It makes more sense if you look at it piecewise. It says for every million parsecs away from us, the outward speed of things in general increases by 70 kilometers per second.”
“That helps, but it mixes old and new units like saying miles per hour per kilometer. Ugly. It’d be prettier if you kept all one system, like (pokes at smartphone screen) … about 2.27 km/sec per 1018 kilometers or … about 8 miles an hour per quadrillion miles. Which ain’t much now that I look at it.”
“Not much, except it adds up over astronomical distances. The Andromeda galaxy, for instance, is 15×1018 miles away from us, so by your numbers it’d be moving away from us at 120,000 miles per hour.”
“Wait, Cathleen, I thought Andromeda is going to collide with the Milky Way four billion years from now.”
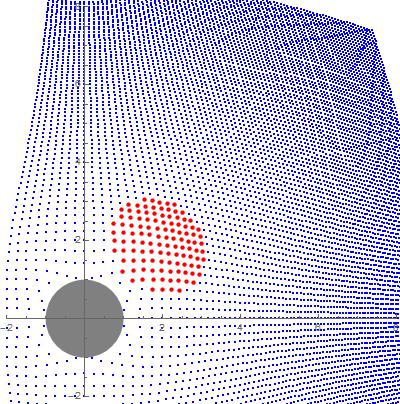
 “It is, Sy, and that’s one of the reasons why Hubble’s original number was so far off. He only looked at about 50 close-by galaxies, some of which are moving toward us and some away. You only get a view of the general movement when you look at large numbers of galaxies at long distances. It’s like looking through a window at a snowfall. If you concentrate on individual flakes you often see one flying upward, even though the fall as a whole is downward. Andromeda’s 250,000 mph march towards us is against the general expansion.”
“Like if I’m flying a plane and the airspeed indicator says I’m doing 200 but my ground-speed is about 140 then I must be fighting a 60-knot headwind.”
“Exactly, Vinnie. For Andromeda the ‘headwind’ is the Hubble Flow, that general outward trend. If Sy’s calculation were valid, which it’s not, then that galaxy 13 billion lightyears from here would indeed be moving further away at 93% of lightspeed. Someone living in that galaxy could shine a 520-nanometer green laser at us. At this end we see the beam stretched by 193% to 1000nm. That’s outside the visible range, well into the near-infrared. All four visible lines in the hydrogen spectrum would be out there, too.”
“So that’s why ‘old hydrogens’ look different — if they’re far enough away in the Hubble Flow they’re flying away from us so fast all their colors get stretched by the red-shift.”
“Right, Vinnie.”
“Wait, Cathleen, what’s wrong with my calculation?”
“Two things, Sy. Because the velocities are close to lightspeed, you need to apply a relativistic correction factor. That velocity ratio Old Reliable reported — call it b. The proper stretch factor is z=√ [(1+b)/(1–b)]. Relativity takes your 93% stretch down to (taps on laptop keyboard) … about 86%. The bluest wavelength on hydrogen’s second-down series would be just barely visible in the red at 680nm.”
“What’s the other thing?”
“The Hubble Constant can’t be constant. Suppose you run the movie backwards. The Universe shrinks steadily at 70 km/sec/Mparsec. You hit zero hundreds of millions of years before the Big Bang.”
“The expansion must have started slow and then accelerated.”
“Vaster and faster, eh?”
“Funny, Sy.”
~~ Rich Olcott


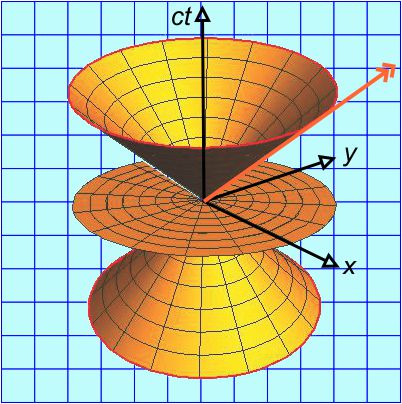
 Last week’s Minkowski diagram was two-dimensional. It showed time running along the vertical axis and Pythagorean distance d=√(x²+y²+z²) along the horizontal one. That was OK in the days before computer graphics, but it loaded many different events onto the same point on the chart. For instance, (0,1,0,0), (0,-1,0,0), (0,0,1,0) and (0,0,0,1) (and more) are all at d=1.
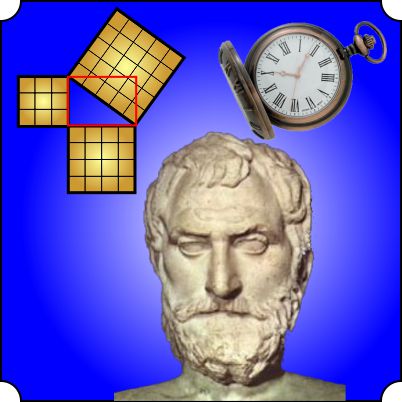

 One more step and we can answer Ken’s question. A moving object’s proper time is defined to be the time measured by a clock affixed to that object. The proper time interval between two events encountered by an object is exactly Minkowski’s spacetime interval. Lucy’s clock never moves from zero.


 Nonetheless, mathematicians and cryptographers have forged ahead, calculating π to more than a trillion digits. Here for your enjoyment are the 99 digits that come after digit million….
 Back to π. The Greeks knew that the circumference of a circle (c) divided by its diameter (d) is π. Furthermore they knew that a circle’s area divided by the square of its radius (r) is also π. Euclid was too smart to try calculating the area of the visible sky in his astronomical work. He had two reasons — he didn’t know the radius of the horizon, and he didn’t know the height of the sky. Later geometers worked out the area of such a spherical cap. I was pleased to learn that π is the ratio of the cap’s area to the square of its chord, s2=r2+h2.
 Astrophysicists and cosmologists look at much bigger figures, ones so large that curvature has to be figured in. There are three possibilities
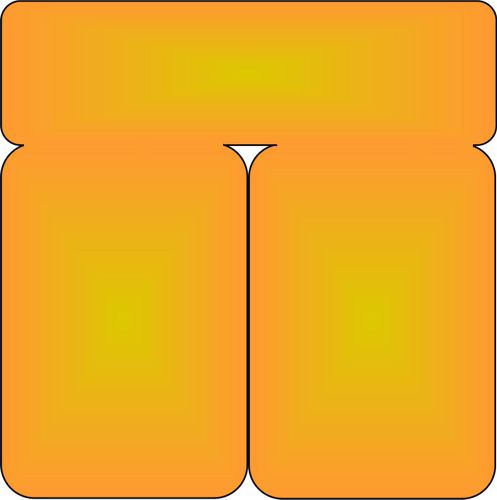
 See that little guy on the bridge, suspended halfway between all the way down and all the way up? That’s us on the cosmic size scale.
 So that’s the size range of the Universe, from 1.6×10⁻³⁵ up to 2.6×1026 meters. What’s a reasonable way to fix a half-way mark between them?