

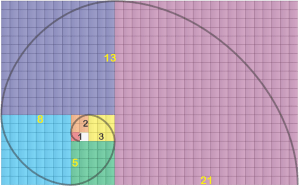
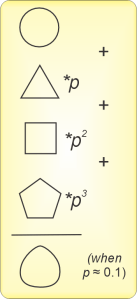
Of course you’ve seen images featuring the Fibonacci spiral, maybe one that overlays the spiral onto a snail shell or the whorls of a sunflower head. As you see, it’s derived from a series of squares, the side of each equal to the sum of the sides of the next two smaller ones. The spiral smoothly connects opposite corners of successive squares. Fibonacci didn’t invent the spiral, but he did discover the {1, 1, 2, 3, 5, 8, 13, 21, 34, …} series it exploits. He’s famous for the series, but that was as dust before his other major contribution to our world.
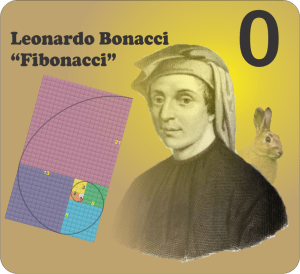
Leonardo was the foremost mathematician of 13th‑century Italy. His father was Guglielmo Bonacci so Leonardo was figli di (son of) Bonacci, hence fi’Bonacci or Fibonacci. As a citizen of the Pisan Republic he was often cited as Leonardo di Pisa, preceding the more famous Leonardo of Vinci (a district in Florence, 90 kilometers east of Pisa) by nearly three centuries.
In 1202 Fibonacci wrote a ground‑breaking mathematics textbook, Liber Abaci, that included many solved examples of problems from trade and finance. His famous rabbit problem was part of the mix.

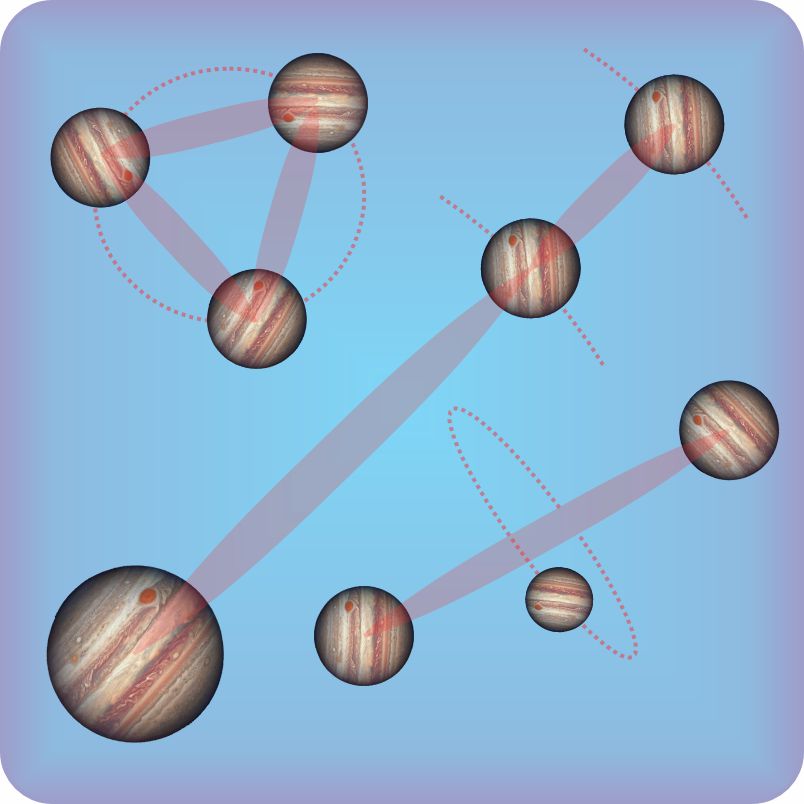
Suppose you’ve got a pair of immortal rabbits that multiply like clockwork — each pair more than a month old produces one additional pair per month. How many pairs would you have after n months? The figure shows the first few stages of the process. At the end of any month you’ve got all the start‑of‑month rabbits plus one pair for each new pair that reached one‑month maturity. 1+2=3, 2+3=5, 3+5=8, 5+8=13, 8+13=21, … That is Fibonacci’s Series.
Australia discovered to its sorrow how rapidly the Series’ numbers can rise. After the first few generations the rabbit population grows literally exponentially (Those two words are misused way too often but they each apply here.).
Exponential growth appears when a process operates periodically on something to produce more of the same thing. The periodicity can be timewise, like seasonal years or generations of living things, or spacewise, like successive outward divisions of the cells that give rise to sunflower seeds or snail shells. If the something comes in units, like rabbit pairs, the growth comes in integers. If the units are small and the numbers are large, like yeast cells in a beer vat, it’s easier to express the growth as a percentage. The small‑unit numbers eventually increase as en/R, where R=½(1+√5). Compound interest? Same mechanism, same mathematics, just more arithmetic.
Back to the 12th century. Papa Bonacci was a merchant engaged in commerce between Pisa and Algiers. Young Leonardo grew up in his Dad’s North African trading post, first observing and later negotiating with Arabian traders who used a number system they’d gotten from Hindu merchants. He was smart enough to appreciate the power inherent in the Hindu‑Arabic number system (powers‑of‑10 positional notation, with a zero indicator to mark each slot where a number lacks a contribution from that 10‑power). In later years he wrote it up, in Liber Abaci.
At the dawn of the 13th century, Europe had been using Roman numerals for a millennium. The Italian trading empires of the 15th century could not have been built without the rigor, discipline and reliability of double‑entry bookkeeping. Can you imagine doing double‑entry accounting, much less compound interest calculations, with Roman numerals? I can’t, either. Europe’s commercial interests simply couldn’t have developed without the trustworthy record‑keeping techniques based on Liber Abaci‘s arithmetic principles. It’s easy to find realistic through‑lines from Fibonacci’s book to most of modern technology.
Today we say that computing is all ones and zeros. Fibonacci brought us the zeroes.
under CC ASA 3.0 license
- 547 is a prime number. This the 547th post in this blog, a suitable spot for me to hit “Pause” so I can free up time for another project. That one promises plenty of rabbit holes like the ones I’ve explored while having fun researching topics here. There are limits. In the future I’ll be posting here irregularly rather than on the weekly schedule I’ve kept to for a decade. Stay in touch.
~ Rich Olcott


.jpg)