

Vinnie gets the deck next, but first thing he does is plop a sheet of paper onto the table. “Topic is black holes, of course. Everybody’s seen this, right?”
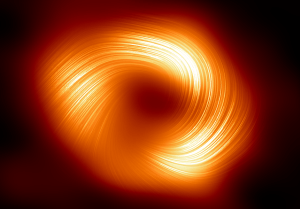
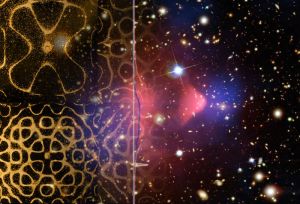
“Sure, it’s the new view of the Milky Way’s super-massive black hole with the extra lines. So deal already.”
“Hold your horses, Cal.” <Vinnie starts dealing.> “I’m looking for explanations. Where’d those lines come from? They swirl across the accretion disk like so much rope, right? Why aren’t they just going straight in orderly‑like? The whole thing just don’t make sense to me.”
Susan bets a few chips. “I saw a similar pop‑sci article, Vinnie. It said the lines trace out polarization in the light waves the Event Horizon Telescope captured. Okay, radio waves — same thing just longer wavelength. Polarized radio waves. I’ve measured concentrations of sugar and amino acid solutions by how much the liquid rotates polarized light, but the light first went through a polarizing filter. How does a black hole make polarized waves?”
Kareem matches Susan’s bet. “Mm‑hm. We use polarized light passing through thin sections of the rocks we sample to characterize the minerals in them. But like Susan says, we don’t make polarized light, we use a filter to subtract out the polarization we don’t want. You’re the physicist, Sy, how does the black hole do the filtering?”
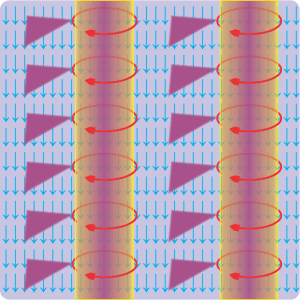
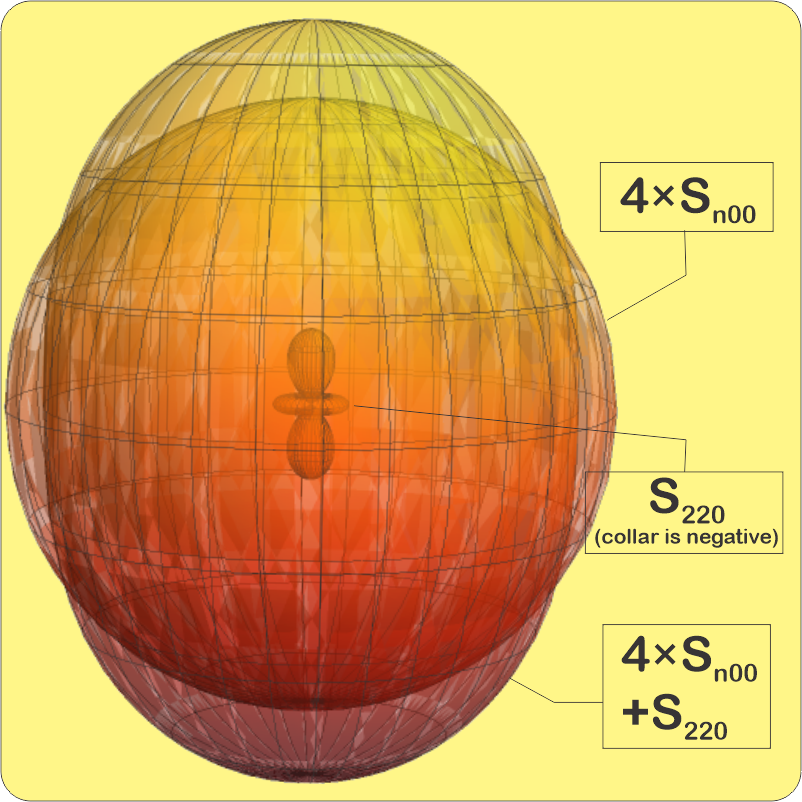
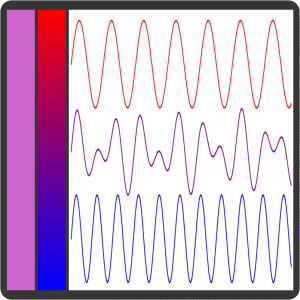
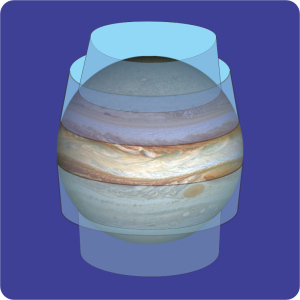
Electric (E) field is red
Magnetic (B) field is blue
(Image by Loo Kang Wee and Fu-Kwun Hwang from Wikimedia Commons)
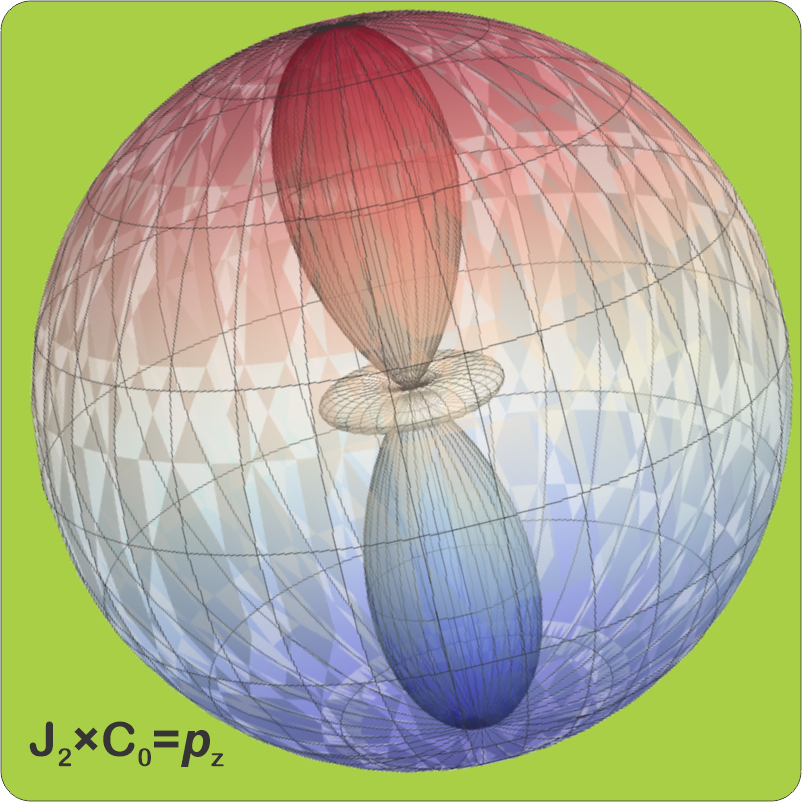
My hand’s good so I match the current ante. “It doesn’t. There’s no filtering, the light just comes out that way. I’d better start with the fundamentals.” <displaying Old Reliable> “Does this look familiar, Vinnie?”
“Yeah, Sy, you’ve used it a lot. That blue dot in the back’s an electron, call it Alice, bobbing straight up and down. That’s the polarization it’s puttin’ on the waves. The red lines are the force that another electron, call it Bob, feels at whatever distance away. Negative‑negative is repelling that so Bob goes down where the red line goes up but you get the basic idea.”
“The blue lines are important here.”
“I’m still hazy on those. They twist things, right?”
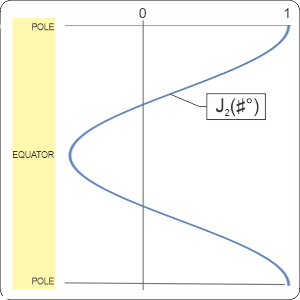
“That’s one way to put it. Hendrik Lorentz put it better when he wrote that Bob in this situation experiences one force with two components. There’s the red‑line charge‑dependent component, plus the blue‑line component that depends on the charge and Bob’s motion relative to Alice. If the two are moving in parallel—”
“The same frame, then. I knew frames would get into this somehow.”
“It’s hard to avoid frames when motion’s the subject. Anyway, if the two electrons are moving in parallel, the blue‑line component has zero effect. If the two are moving in different directions, the blue‑line component rotates Bob’s motion perpendicular to Alice’s red‑line polarization plane. How much rotation depends on the angle between the two headings — it’s a maximum when Bob’s moving perpendicular to Alice’s motion.”
“Wait, if this is about relative motion, then Bob thinks Alice is twisting, too. If she thinks he’s being rotated down, then he thinks she’s being rotated up, right? Action‑reaction?”
“Absolutely, Vinnie. Now let’s add Carl to the cast.”
“Carl?”
begets motion that generates new polarized light.
“Distant observer at right angles to Alice’s polarization plane. From Carl’s point of view both electrons are just tracking vertically. Charges in motion generate lightwaves so Carl sees light polarized in that plane.”
Cathleen’s getting impatient, makes her bet with a rattle of chips. “What’s all this got to do with the lines in the EHT image?”
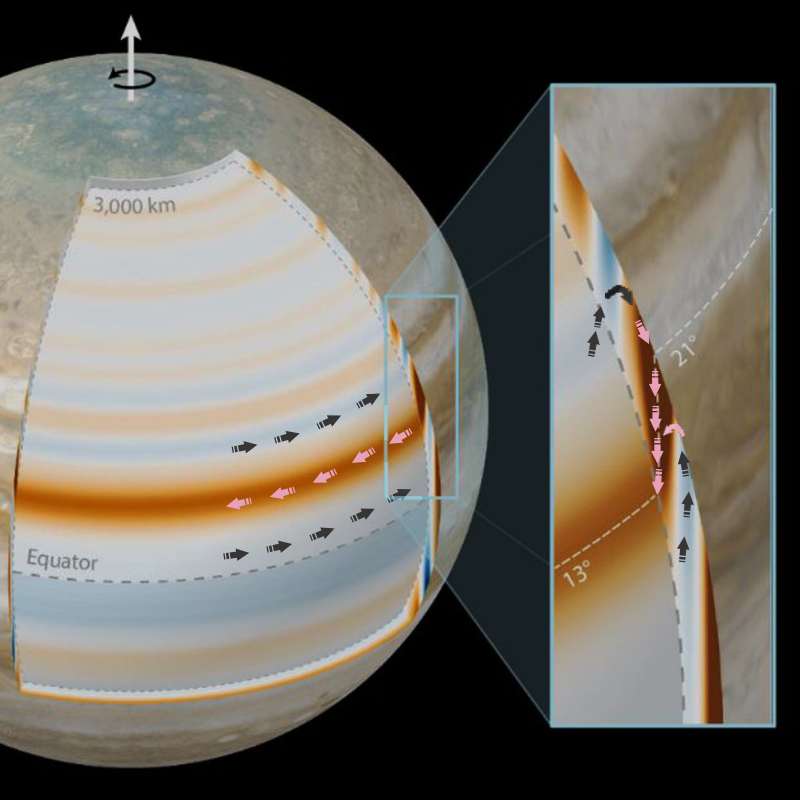
“The hole’s magnetic field herds charged particles into rotating circular columns. Faraday would say each column centers on a line of force. Alice and a lot of other charged particles race around some column. Bob and a lot of other particles vibrate along the column and emit polarized light which shows up as bright lines in the EHT image.”
“But why are the columns twisted?”
“Orbit speed in the accretion disk increases toward its center. I’d bet that’s what distorts the columns. Also, I’ve got four kings.”
“That takes this pot, Sy.”
~~ Rich Olcott


