Jupiter And The Atoms

“Okay, Sy, what’s your third solution?”

“Solution to what, Susan?”

These harmonic thingies. They’re about angles so it makes sense to chart them in polar or spherical coordinates, but when they take on negative values the radius goes the wrong way. You said one solution was to chart the negatives in a different color. That’s confusing, though. Another solution is to square all the values to get everything into positive territory. That’s okay for chemists like me because the peaks and nodes we care about stay in the same places. What’s the third option?”

“One that gets to why these ‘harmonic thingies’ are interesting at all. When Juno‘s orbiting Jupiter, does it feel each of Kaspi’s Jn shapes individually?”

“No, of course not, she just reacts to how they all add togethherrr … Oh! So you’re saying we can handle negative values from one harmonic by adding it to another one that’s more positive and plotting the combination.”

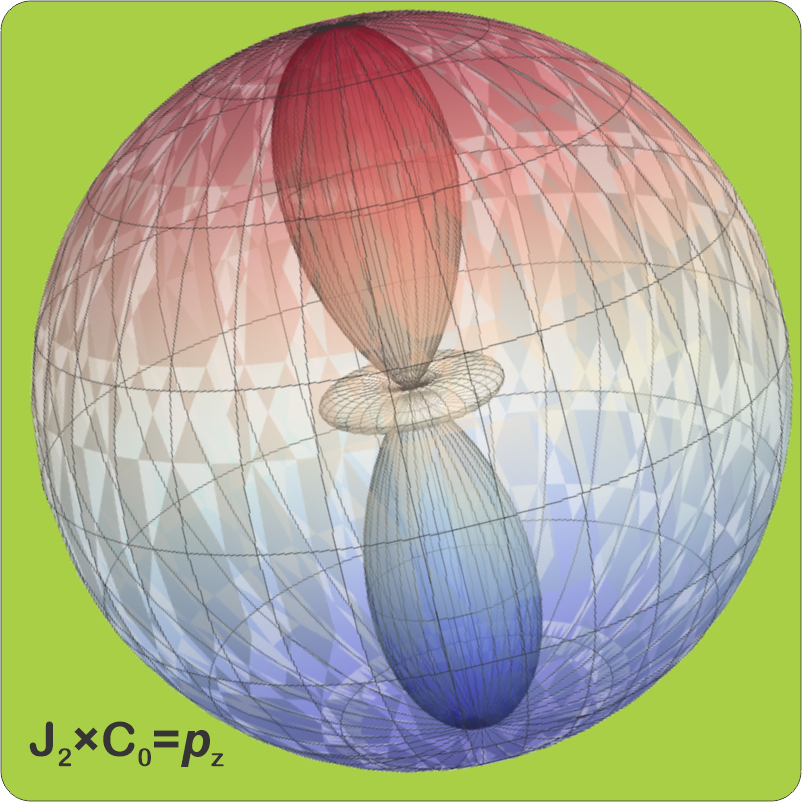
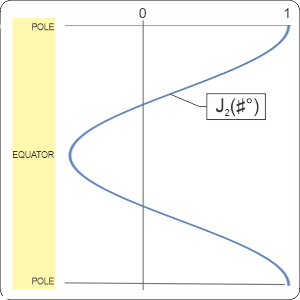
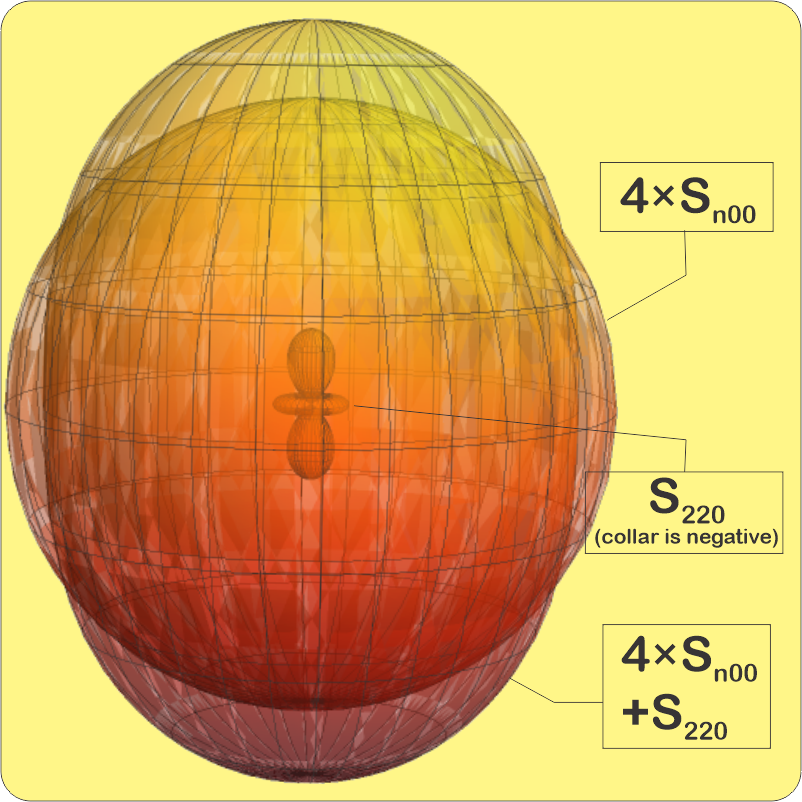
<pointing to paper napkin> “Bingo! Remember this linear plot of J2 where I colored its negative section pink?” <pointing to display on Old Reliable> “When you multiply J2 by C0 you get S220. I added that to four helpings of Sn00 to get this combination.”

“Ah, that negative region in S220‘s middle shaves back the equator on Sn00‘s sphere while the positive part adds bumps top and bottom.” <Susan gives me the side‑eye> “Why’d you pick that 4‑to‑1 ratio, and what’s with those n subscripts instead of numbers?”

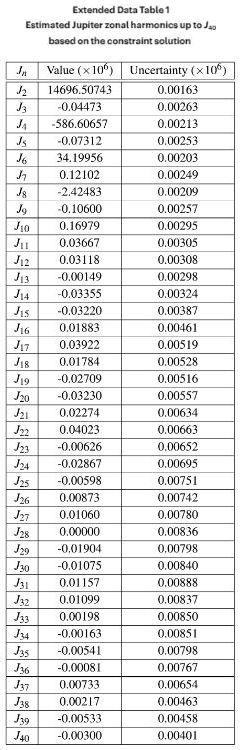
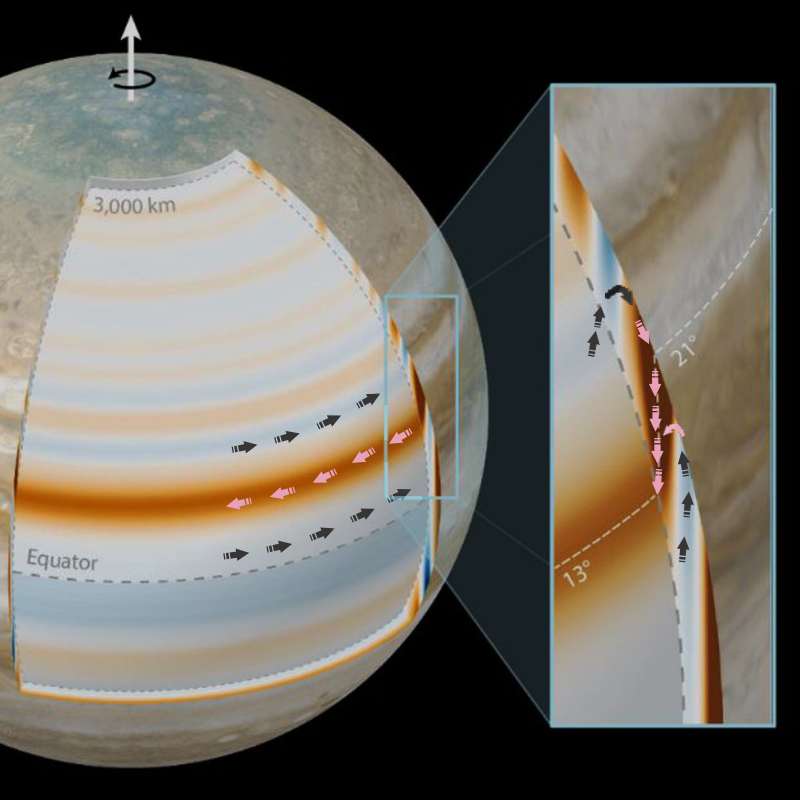
“Getting a little ahead of myself. For the moment let’s concentrate on Juno‘s experience with Jupiter’s gravity. One reason I chose that ratio was that it’s pretty easy to see in the picture. In real cases the physical system determines the ratios. Kaspi’s team derived their ratios experimentally. They used math to fit a model to Juno‘s very slightly wobbly orbit. Their model of Jupiter’s gravity field started from the spherical J0 shape. They tweaked that by adding different ratios of J2 through J40, adjusting the ratios until the model’s total gravity field predicted an orbit that matched the real‑world one. J2‘s share was about 15 parts per thousand but most of the rest contributed less than a part per million. Jupiter probably uses multiple mass blobs to make the J2 shape. The point is, the planet’s really a mess but we can analyze the mess in terms of the harmonics.”

“So that’s how you drew what Cal called your wiggle-waggles — you followed Kaski’s Jn recipe and then added some constant to push the polar plot out far enough that the negatives didn’t poke out the wrong side. That constant — what value did you use and why that one?”

“That’s exactly what I did do, Cathleen. Frankly, I don’t even remember what constant I added, just something that was big enough to make the negatives behave nicely, not so large that the peaks vanished by comparison. Calibrating accurately to Jupiter’s J0 would shrink the peaks down to parts‑per‑thousand invisibility. After all, I was more concerned with peak position than peak size.”

“Now we’re back to your 4‑to‑1 ratio. Was that arbitrary, too?”

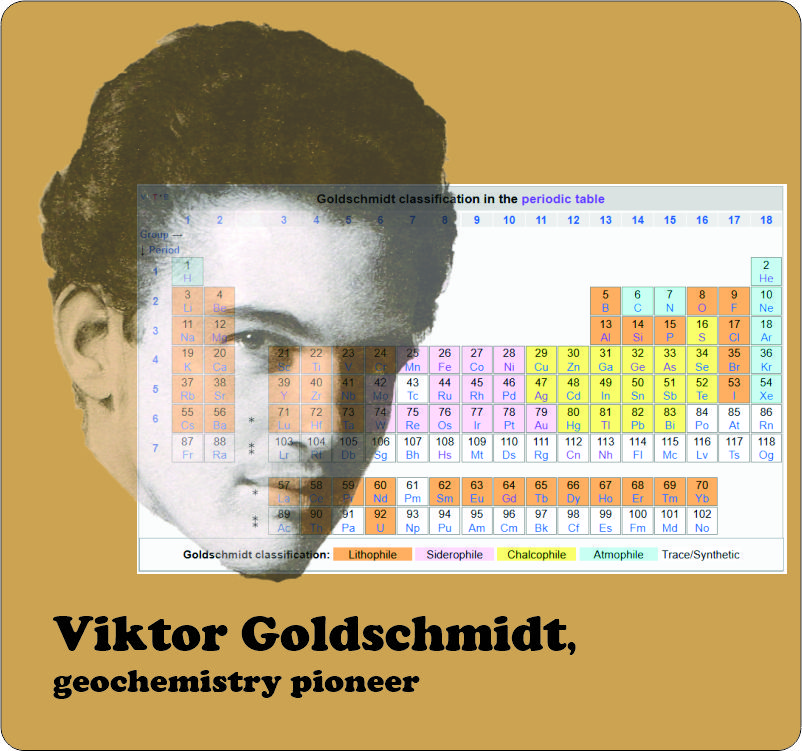
“No, it wasn’t, Susan. Would it have been closer to Chemistry if I’d labeled that figure as 1s22s22p1?”

“Two electrons in the 1s‑shell, two in the 2s‑shell plus one 2p electron … that’s a boron atom? But you’re showing only one radial shell, not two separate ones.”

“True, but that’s to make another point. There isn’t an electron in the 1s shell, or even a pair of them nicely staying on opposite sides. The atom’s charge, all five electrons‑worth of it, is smeared out as a wave pattern across the entire structure. The Sn00 pattern captures everything that’s spherical. The S220 pattern gets what’s left.”

“But what about the radial nodes? Isn’t that the difference between 1s and 2s, that 2s has a node?”

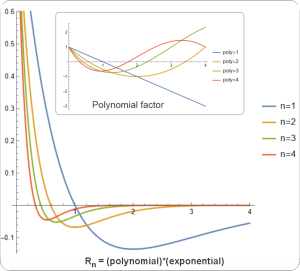
“Oh there are nodes, alright, but they don’t have much effect. Each radial harmonic is the product of two factors — a polynomial and an exponential. The exponential part squeezes the polynomial so hard that adjacent peaks and valleys are barely bumps and dents.”

“So Jupiter and atoms use the same math, huh?”

“So does the Sun.”

~~ Rich Olcott

Shapes And Numbers

I’m nursing my usual mug of eye‑opener in Cal’s Coffee Shop when astronomer Cathleen and chemist Susan chatter in and head for my table. Susan fires the first volley.

“Sy, those spherical harmonics you’ve posted don’t look anything like the atomic orbitals in my Chem text. Shouldn’t they?”
 ”How do you add and multiply shapes together?”
  ”What does the result even mean?”
   ”And what was that about solar seismology?”

“Whoa, have you guys taken interrogation lessons from Mr Feder? One at a time, please. Let’s start with the basics.” <sketching on a paper napkin> “For example, the J2 zonal harmonic depends only on the latitude, not on the longitude or the distance from the center, so whatever it does encircles the axis. Starting at the north pole and swinging down to the south pole, the blue line shows how J2 varies from 1.0 down to some negative decimal. At any latitude, whatever else is going on will be multiplied by the local value of J2.”

“The maximum is 1.0, huh? Something multiplied by a number less than 1 becomes even smaller. But what happens where J2 is zero? Or goes negative?”

“Wherever Jn‘s zero you’re multiplying by zero which makes that location a node. Furthermore, the zero extends along its latitude all around the sphere so the node’s a ring. J2‘s negative value range does just what you’d expect it to — multiply by the magnitude but flip the product’s sign. No real problem with that, but can you see the problem in drawing a polar graph of it?”

“Sure. The radius in a polar graph starts from zero at the center. A negative radius wouldn’t make sense mixed in with positives in the opposite direction.”

“Well it can, Cathleen, but you need to label it properly, make the negative region a different color or something. There are other ways to handle the problem. The most common is to square everything.” <another paper napkin> “That makes all the values positive.”

“But squaring a magnitude less than 1 makes it an even smaller multiplier.”

“That does distort the shapes a bit but it has absolutely no effect on where the nodes are. ’Nothin’ times nothin’ is nothin’,’ like the song says. Many of the Chem text orbital illustrations I’ve seen emphasize the peaks and nodes. That’s exactly what you’d get from a square‑everything approach. Makes sense in a quantum context, because the squared functions model electron charge distributions.”

“Thanks for the nod, Sy. We chemists care about charge peaks and nodes around atoms because they control molecular structures. Chemical bonds and reactions tend to localize near those places.”

“I aim for fairness, Susan. There is another way to handle a negative radius but it needs more context to look reasonable. Meanwhile, we’ve established that at any given latitude each Jn is just a number so let’s look at longitudes.” <a third paper napkin> “Here’s the first two sectorial harmonics plotted out in linear coordinates.”

“Looks familiar.”

“Mm‑hm. Similar principles, except that we’re looking at a full circle and the value at 360° must match the value at 0°. That’s why Cm always has an even node count — with an odd number you’d have -1 facing +1 and that’s not stable. In polar coordinates,” <the fourth paper napkin> “it’s like you’re looking down at the north pole. C0 says ‘no directional dependence,’ but C1 plays favorites. By the way, see how C1‘s negative radii in the 90°‑270° range flip direction to cover up the positives?”

“Ah, I see where you’re going, Sy. Each of these harmonics has a numeric value at each angle around the center. You’re going to tell us that we can multiply the shapes by multiplying their values point by point, one for each latitude for a J and each longitude for a C.”

“You’re way ahead of me as usual, Cathleen. You with us, Susan?”

“Oh, yes. In my head I multiplied your J2 by C0 and got a pz orbital.”

“I’m impressed.”
 ”Me, too.”

“Oh, I didn’t do it numerically. I just followed the nodes. J2 has two latitude nodes, C0 has no longitude nodes. There it is, easy‑peasy.”

~~ Rich Olcott

Screaming Out Of Space

Cal (formerly known as Al) comes over to our table in his coffee shop. “Lessee if I got this right. Cathleen is smug twice. First time because the new results from Juno‘s data say her hunch is right that Jupiter’s atmosphere moves like cylinders inside each other. Nearly cylinders, anyhow. Second smug because Sy used the Juno data to draw a math picture he says shows the Great Red Spot but I’m lookin’ at it and I don’t see how your wiggle‑waggles show a Spot. That’s a weird map, so why’re you smug about it, Cathleen?”

“The map’s weird because it’s abstract and way different from the maps you’re used to. It’s also weird because of how the data was collected. Sy, you tell him about the arcs.”

“Okay. Umm… Cal, the maps you’re familiar with are two‑dimensional. City maps show you north‑south and east‑west, that’s one dimension for each direction pair. Maps for bigger‑scale territories use latitude for north‑south and longitude for east‑west but the principle’s the same. The Kaspi group’s calculations from Juno‘s orbit data give us a recipe for only a one‑dimensional map. They show how Jupiter’s gravity varies by latitude, nothing about longitude. We could plot that as a rectangle, latitude along the x‑axis, relative strength along the y‑axis. I thought I’d learn more by wrapping the x‑axis around the planet so we could look for correlations with Jupiter’s geography. I found something and that’s why Cathleen’s smug. Me, too.”

“Why latitude but nothing about longitude?”

“Because of the way Juno‘s orbit works. The spacecraft’s not hovering over the planet or even circling it like the ISS circles Earth. NASA wanted to minimize Juno‘s exposure to Jupiter’s intense magnetic and radiation fields. The craft spends most of its 53‑day orbit at extreme distance, up to millions of kilometers out. When it approaches, it screams in at about 41 kilometers per second, that’s 91 700 mph, on a mostly north‑to‑south vector so it sees all latitudes from a few thousand kilometers above the cloud‑tops. Close approach lasts only about three hours, for the whole planet, and then the thing is on its way out again. During that three hours, the planet rotates about 120° underneath Juno so we don’t have a straight vertical N‑S pass down the planet’s face. Gathering useful longitude data’s going to take a lot more orbits.”

“So you’re sayin’ Juno felt gravity glitches at all different angles going pole to pole, but only some of the angles going round and round.”

“Exactly.”

“So now explain the wiggle‑waggles.”

“They represent parts‑per‑million variations in the field pulling Juno towards Jupiter at each latitude. Where the craft is over a more massive region it’s pulled a bit inwards and Sy’s map shows that as a green bump. Over a lighter region Juno‘s free to move outward a little and the map shows a pink dip. Kaspi and company interpret the heaviness just north of the equator to be a dense inward flow of gas all around the planet. Maybe it is. Sy and I think the pink droplet south of the equator could reflect the Great Red Spot lowering the average mass at its latitude. Maybe it is. As always, we need more data, okay? Now I’ve got questions for you, Sy.”

“Shoot.”

“You built your map by multiplying each Jn‑shape by its Kaspi gravitational intensity then adding the multiplied shapes together. But you only used Jn‑shapes with integer names. Is there a J½?”

“Some mathematicians play with fractional J‑thingies but I’ve not followed that topic.”

“Understandable. Next question — the J‘s look so much like sine waves. Why not just use sine‑shapes?”

“I used Jn‑shapes because that’s how Kaspi’s group stated their results. They had no choice in the matter. Jn‑shapes naturally appear in spherical system math. The nice thing about Jn‑shapes is that n provides a sort of wavelength scale. For instance, J35 divides Jupiter’s pole‑to‑pole arc into 36 segments each as wide as Earth’s diameter. Here’s a plot of intensity against n.”

Adapted from Kaspi, Figure 2a

“Left to right, red light to blue.”

“Exactly.”

~ Rich Olcott

Zoning Out over Jupiter

I’m nursing my usual mug of eye‑opener in Cal’s Coffee Shop when astronomer Cathleen and chemist Susan chatter in. “Morning, ladies. Cathleen, prepare to be even more smug.”

“Ooo, what should I be smug about?”

Your Jupiter suggestion. Grab some coffee and a couple of chairs.” <screen‑tapping on Old Reliable> “Ready? First step — purple and violet. You’ll never see violet or purple light coming from a standard video screen.”

“He’s going spectrum‑y on us, right, Cathleen?”

“More like anti‑spectrum‑y, Susan. Purple light doesn’t exist in the spectrum. We only perceive that color when we see red mixed with blue like that second band on Sy’s display. Violet light is a thing in nature, we can see it in flowers and dyes and rainbows beyond blue. Standard screens can’t show violet because their LEDs just emit red, blue and green wavelengths. Old Reliable uses mixtures of those three to fake all its colors. Where are you going with this, Sy?””

“Deeper into Physics. Cast your eyes upon the squiggles to the right. The one in the middle represents the lightwave coming from purple‑in‑the‑middle. The waveform’s jaggedy, but if you compare peaks and troughs you can see its shape is the sum of the red and blue shapes. I scaled the graphs up from 700 nanometers for red and 450 for blue.”

“Straightforward spectroscopy, Sy, Fourier analysis of a complicated linear waveform. Some astronomers make their living using that principle. So do audio engineers and lots of other people.”

“Patience, Cathleen, I’m going beyond linear. Fourier’s work applies to variation along a line. Legendre and Poisson extended the analysis to—”

“Aah, spherical harmonics! I remember them from Physical Chemistry class. They’re what gives shapes to atoms. They’ve got electron shells arranged around the nucleus. Electron charge stays as close to the nucleus as quantum will let it. Atoms absorb light energy by moving charge away from there. If the atom’s in a magnetic field or near other atoms that gives it a z-axis direction then the shells split into wavey lumps going to the poles and different directions and that’s your p-, d– and f-orbitals. Bigger shells have more room and they make weird forms but only the transition metals care about that.”

The angular portion of the lowest-energy spherical harmonics
Credit: Inigo.quilez, under CCA SA 3.0 license

“Considering you left out all the math, Susan, that’s a reasonable summary. I prefer to think of spherical harmonics as combinations of wave shapes at right angles. Imagine a spherical blob of water floating in space. If you tap it on top, waves ripple down to the bottom and back up again and maybe back down again. Those are zonal waves. A zonal harmonic averages over all E‑W longitudes at each N‑S latitude. Or you could stroke the blob on the side and set up a sectorial wave pattern that averages latitudes.”

“How about center‑out radial waves?”

“Susan’s shells do that job. My point was going to be that what sine waves do for characterizing linear things like sound and light, spherical harmonics do for central‑force systems. We describe charge in atoms, yes, but also sound coming from an explosion, heat circulating in a star, gravity shaping a planet. Specifically, Jupiter. Kaspi’s paper you gave me, Cathleen, I read it all the way to the Results table at the tail end. That was the rabbit‑hole.”

“Oh? What’s in the table?”

“Jupiter’s zonal harmonics — J‑names in the first column, J‑intensities in the second. Jn‘s shape resembles a sine wave and has n zeroes. Jupiter’s never‑zero central field is J0. Jn increases or decreases J0‘s strength wherever it’s non‑zero. For Jupiter that’s mostly by parts per million. What’s cool is the pattern you see when you total the dominating Jeven contributions.”

Data from Kaspi, et al.

Cathleen’s squinting in thought. “Hmm… green zone A would be excess gravity from Jupiter’s equatorial bulge. B‘s excess is right where Kaspi proposed the heavy downflow. Ah‑HAH! C‘s pink deficit zone’s right on top of the Great Red Spot’s buoyant updraft. Perfect! Okay, I’m smug.”

~ Rich Olcott

Revising The Model

Cathleen’s perched at a table in Cal’s Coffee Shop, sipping a latte and looking smug. “Hi, Sy.”

“Hi, yourself. Did somebody you don’t like get a well‑deserved comeuppance?”

“Nothing that juicy. Just an old hunch that’s gotten some strong new supporting evidence. I love it when that happens.”

“So what’s the hunch and what’s the evidence?”

“You’ve already heard the hunch.” <dialing up an image on her phone> “Remember this sketch?”

“Hmmm, yeah, you and Vinnie were debating Jupiter’s atmosphere. Its massive airflows could self‑organize as an oniony nest of concentric spherical shells, or maybe concentric cylinders like that picture on your phone. Later on Vinnie thought up a more dynamic option — cylindrical shells encasing sets of smaller tornados like roller bearings. You shot that one down, right?”

“Mostly. I did admit something like that might work at the poles. Anyway, I’ve liked the concentric cylinders model for quite a while. This paper I just read says I’m almost but not quite right. Kaspi and company’s data says the cylinders are cone sections, not cylinders, and they’re not north‑south symmetrical.” <dialing up another image> “It’s like this except I’ve exaggerated the angles.”

“Doesn’t look all that different to me. Congratulations on the near‑win. What’s the new model based on? Did Juno drop another probe into the atmosphere?”

“Nope. Remote sensing, down as far as 3000 kilometers.”

“I thought Jupiter’s cloud decks blocked infrared.”

“Another nope. Not infrared sensing, gravity.”

“Didn’t know Juno carried a gravimeter.”

“It doesn’t, that’d be way too heavy and complex. Juno itself was the remote sensor. Whenever NASA’s Deep Space Network captured a data transmission from Juno, they also recorded the incoming radio signal’s precise frequency. Juno‘s sending frequency is a known quantity. Red‑shifts and blue‑shifts as received told us Juno‘s then‑current velocity relative to Earth. The shifts are in the parts‑per‑million range, tiny, but each speed‑up or slow‑down carries information about Jupiter’s gravitational field at that point in Juno‘s orbit. Given velocity data for enough points along enough orbits, you can build a gravity atlas. This paper reports what the researchers got from orbits 1 through 37.”

“Cute idea. They’ve built the atlas, I suppose, but what can gravity say about your wind cylinders?”

“Winds in Jupiter’s atmosphere are driven by heat rising from the core. Put a balloon 3000 kilometers down. Heated air inside the balloon expands. That has two effects. One, the balloon is less dense than its surroundings so it rises. Two, the work of expanding against outside pressure drains thermal energy and cools the balloon’s air molecules. The process continues until the balloon gets up to where its temperature and pressure match what’s outside, right?”

“Which is probably going to be well above 3000 kilometers. Hmm… if you’ve got lots of balloons doing that, as they fly upward they leave a vacuum sort of. Excess balloons up top will be pulled downward to fill the void.”

“Now organize all those balloons in a couple of columns, one going up and one down. Will they have equal mass?”

“Interesting. No, they won’t. The rising column rises because it’s less dense than its surroundings and the falling column falls because it’s more dense. More mass per unit volume in the falling column so that’s heavier.”

“Eighteenth Century Physics. Planetary rotation forces columns of each kind to merge into a nest of separate cones. Rising‑column warm cones support Jupiter’s white ammonia‑ice zones. Falling‑column cool cones disclose red‑brown belts. The gravity field is stronger above the dense falling regions, weaker over the light rising ones. Juno responded to gravity’s wobbles; the researchers built their models to fit Juno‘s wobbles. The best models aren’t quite concentric cylinders, because the cones tilt poleward. This graphic tells the story. The rectangle shows a 3000‑kilometer vertical section. The between-shell boundaries are effective — the paper specifically says that mass transport inward from the outermost shell is insignificant.”

“You said the data’s asymmetric?”

“Yep. The strongest part of the gravitational signal came from flow angling down and equator‑ward, 21°N to 13°N.”

“Why’s that?”

“Maybe the Great Red Spot down south drives everything northward. We don’t know.”

~ Rich Olcott

A Disk of Heat And Violence

Susan suddenly sits bolt upright. “WOW! Kareem, that Chicxulub meteor that killed off the dinosaurs — paleontologists found iridium from it all over the world, right?”

“Right, the famous K‑T or K‑Pg boundary So?”

“It’d take a lot of iridium to cover the world. Iridium’s deep in the Periodic Table’s Soft Siderophile territory. Iron’s Soft. When Earth was molten, iron would extract and concentrate iridium. That’s why there’s so little iridium in Earth’s crust ’cause it’s all gone to the core. That iridium‑carrying meteorite must have been the iron kind.”

“Probably.”

Vinnie guffaws. “HAW! Earth’s Hard and crunchy on the outside, Soft and chewy in the inside, just like a good cookie.”

“Or an armored knight, from the dragon’s viewpoint. But how did Earth get that way, Cathleen?”

“Long story, Sy. The academics are still arguing about the details.”

“I love a good story, especially if it ends up explaining asteroid Psyche.”

“It starts 4½ billion years ago, when the Solar System was a rotating disk of galactic debris, clouds of hydrogen plus heavier dust and grit spewed out by energetic stars. Some of the atoms in that grit were important, right, Kareem?”

“Yup. Iron and nickel for planetary cores, silicon and oxygen for the crusts, radioactive isotopes of potassium, uranium and thorium but especially the short‑lived radioactives like aluminum‑26. Half‑life for that one’s only a million years.”

Al, Eddie and Vinnie erupt.
 ”If the short‑timers are gone, how come you say they were important?”
  ”How do we know they were even there?”
   ”If it’s such a short‑timer, is that stuff even a thing any more?”

Kareem’s not used to such a barrage but Cathleen’s a seasoned teacher. “Aluminum‑26 definitely is still a thing, because it’s continually produced by cosmic rays colliding with silicon atoms that aren’t too deeply buried. The production rate is so steady that Kareem’s colleagues estimate how long a meteorite was exposed to cosmic rays from its load of aluminum‑26 decay products compared to its related stable isotopes. We know aluminum‑26 was in the early debris because we’ve found its decay products on Earth. We even know how much — about 50 atoms per million stable aluminum atoms.”

Kareem regains his footing. “As to why it’s important, molten silicate droplets in the early system became chondrules when they aggregated to form chondritic meteorites. The droplets couldn’t have stayed that hot just from nuclear fission by their long‑lived radioactives. The short‑timers, especially aluminum‑26, must have supplied the extra heat early on. If short‑timers could keep the droplets molten, they certainly could have kept the newly‑forming planets molten for a while. Being fluid’s important because that’s the only state where Susan’s Hard‑Soft phase separation can happen.”

Cathleen nods. “The radioactives were just part of the story, though. The early system was a chaotic place. Forget notions of everything smoothly whirling around like the rings of Saturn. Except for the biggest objects, the idea of an orbit was just silly. Each object was gravitationally influenced by beaucoodles of other objects of all sizes that didn’t even all go in the same direction. There was crashing, lots of crashing. Every smash‑up converted kinetic energy to heat, lots of heat. Each collision could generate fragments which would cascade on to other collisions, maybe even become meteorites. Large objects would accumulate mass and heat energy in violent mergers with smaller objects. A protoplanet’s atom‑level Hard‑Hard and Soft‑Soft interactions would have plenty of chemical opportunities to assemble cohesive masses rising or sinking through the liquid melt just because of buoyancy and there you’ve got your layers.”

“But collisions didn’t have to be violent, Cathleen. Fragments could hang together through gravity or surface stickiness. That’s how the Bennu and Ryugu rubble pile asteroids formed.”

“Good point, Kareem, and that brings us to Psyche. We know its density is higher than stone but less than iron. The asteroid could be part of a planetoid’s interior, surviving after violent collisions chipped away the surface rock. It could be a rubble pile of loose metallic bits. It could be a mix of metal and rock like the Museum’s pallasite slice. Or an armored shell. We just won’t know until the Psyche mission gets there.”

~~ Rich Olcott

Planetary Chemistry

The deal’s gone round to Susan. “Another thing, Kareem — your assumption ignores Chemistry.”

“Didn’t Cathleen take care of that with her nuclear reactions in the star’s core?”

“Not even close. Nuclear reactions in general are literally a million or more times more energetic than chemical ones. Your classic AA alkaline battery is 1½ volts, right, but the initial step in Cathleen’s proton‑to‑helium process would net 1½ megavolts if we could set it up in a battery. Regular chemistry just re‑arranges atoms, doesn’t have a chance when nuclear’s going on.”

“Like trying to carve a cameo with dynamite, huh?”

“Not quite. If nuclear is dynamite, then bench chemistry is a bandsaw. I’d say the analog for carving a cameo would be cell biology. That operates at the millivolt level.”

Cathleen holds up her tablet again. “Speaking of abundance graphs, here’s another one I built for my Astronomy class. I divided each element’s atom count in Earth’s crust by its atom count in the Universe. I color-coded the points according to Goldschmidt’s classification scheme. The lines mark the average ratio for each class. Compared to the Universe, oxide‑formers are ten times more concentrated in the crust than sulfide‑formers are, 150 times more concentrated than iron‑mixers, 900 times more than gases. I see the numbers but I don’t feel comfortable with them. Kareem, what do I tell my students?”

“Happy to explain the what, but Susan will have to explain the why. Goldschmidt started as a mineralogist, invented Geochemistry while bouncing around between Sweden, Norway and Germany until he barely escaped from the Nazis and was smuggled into England. He pioneered using crystallographic and thermodynamic analysis in geology. His scheme slotted each chemical element into one of those five classes. For example, he lumped the five lightest inert gases together with hydrogen, nitrogen and carbon into what he called the Atmophile class because they mostly stay in the atmosphere.”

“Carbon?”

“Yeah, that one’s iffy because coal and limestone. His reasoning involved carbon monoxide, carbon dioxide and methane which don’t show up in rocks. There are other edge cases, like radon which ought to count as a gas but shows up in rocks and basements because it’s locked where it was generated as part of uranium’s decay sequence. We mostly find uranium in oxide minerals so Goldschmidt put it and radon into his Lithophile class of metals that occur in oxides. That’s opposed to mercury, silver and a dozen or so other elements that generally show up in sulfide minerals — that’s his Chalcophile class. There’s another dozen or so that dissolve into molten iron so they’re Siderophiles. We don’t see much of those in Earth’s crust because they were swept down to the core as the molten planet differentiated. Finally, there’s a whole batch of radioactives that huddle together as Other. But why those elements do those things, I dunno. Susan, your turn.”

“It’s a lovely application of Pearson’s Hard‑Soft Acid‑Base theory. Hard chemical thingies have a high charge‑to‑volume ratio. Also, their charge is tightly bound so it doesn’t polarize. Oxide, carbonate and fluoride ions are Hard, and so are alkali and alkali metal ions like sodium and calcium. Uranium’s Hard when it’s at high oxidation state like in a uranyl ion UO22+. (Eddie, stop snickering, that’s its proper name.) Soft thingies are just the reverse — big thingies with mushy electron clouds. Iodide is Soft and so are mercury, silver and gold ions. Bulk metals are extremely Soft, chemically speaking, because their electron clouds are so diffuse. The point is, Hard thingies combine best with Hard thingies, Soft thingies with Soft.”

“So the Lithophiles are Hard metals that make Hard‑Hard stony oxides. I suppose that extends to fluorides and carbonates?”

“Sure.”

“Then the sulfide ores, Goldschmidt’s Chalcogens, are Soft‑Soft compounds. The Siderophile metals combine with each other better than anyone else, and the Atmophiles don’t combine with anything. Cool.”

“Ah‑HAH! Then on my graph the Hard oxides are most common in the crust because they’re light and so float above the heavier Soft sulfides and the ultra‑Soft metals that sink to the core. Our planet is layered by Hardness.”

“Does the same logic apply to asteroids?”

“Sort of.”

~~ Rich Olcott

The Road to Gold

Cathleen and Susan share a look.
 ”A conclusion way too far, Kareem.”
  ”Yep, you’ve overbounded your steps.”

Kareem tosses in a couple of chips. “Huh? What did I skip over? Where?”

Cathleen sees his bet and raises. “When you said that the Psyche asteroid’s gold content would be similar to what we dig up on Earth, you skipped many orders of magnitude in applying the Cosmological Principle.”

“I didn’t realize I’d done that. What’s the Cosmological Principle?”

“There’s several ways to state it, but they boil down to, ‘We’re not special in the Universe.‘ We think that fundamental constants and physical laws determined here on Earth have the same values and work the same way everywhere. Astrophysics just wouldn’t work as well as it does if the electron charge or Newton’s Laws of Motion were different a million lightyears away from us.”

“Wait, what about that galaxy that’s going to collide with us even though everything’s supposed to be flying away?”

“Fair question. The un‑boiled Principle includes some qualification clauses, especially the one that says, ‘when averaged over a large enough volume.’ How big a volume depends on what you’re studying. For motions of galaxies and such you have to average over a couple hundred million lightyears. Physical constants measured locally seem to be good out to the edge of the Observable Universe. Elemental abundances are somewhere in‑between — the very oldest, farthest‑away galaxies have less of the heavy stuff than we do around here. <pulls her tablet from her purse> Which brings me to this chart I built for one of my classes.”

“You’re going to have to explain that.”

“Sure. Both graphs are about element abundance. We get the numbers from stellar and galactic spectra so we’re averaging the local Universe out to a few hundred thousand lightyears. Left‑to‑right we’ve got hydrogen, helium, lithium and so on out to uranium in the big graph, out to iron in the small one. Up‑and‑down we’ve got atom count for each element, divided by the number of iron atoms so iron scores at 1.0. The range is huge, 31 000 hydrogens per single iron atom, all the way down to 17 rhenium atoms per billion irons. I needed this logarithmic scale to make the points I wanted to make in class.”

Vinnie sweetens the pot. “You’ve got that nice zig‑zag going in the little graph, Cathleen, but things get weird around iron and the big graph has that near‑constant series starting around 60. Why the differences?”

<lays down Q‑J‑10‑9‑8, all hearts, pulls in the chips> “Perfect straight line, Vinnie. The different behaviors come from nuclear cookery at different stages of a star’s life. Most new‑born stars start by fusing hydrogen nuclei, protons, to produce helium nuclei, alpha particles. Those two swamp everything else. As the star evolves to higher temperatures, proton‑addition processes generate successively more massive nuclei. Carbon starts a new pattern, because alpha‑addition processes it initiates generate the sawtooth pattern you picked up on — an alpha has two protons so each alpha fusion contributes to the atomic number peak two units along the line.”

“What happens with iron?”

“What happens when you put a blow torch to a red‑hot metal ball?”

“The ball melts.”

“Why?”

“Cause the extra energy’s too much for what holds the ball together.”

“Well, there you go. The forces that hold an atomic nucleus together have their limits, too. Iron and its next‑but‑one neighbor nickel are right on the edge of stability for alpha reactions. The alpha process in the core of a normal star can’t make anything heavier.”

“So how do we get the heavy guys?”

“Novas, supernovas and beyond. Those events are so energetic and so chaotic there’s non‑zero probability for any kind of atom to form and evolve to something stable before it can break down. Massive atoms just have a lower probability so there’s less of them when things settle down. Gold, for instance, at only 330 atoms per billion atoms of iron. The explosions spray heavy atoms throughout their neighborhood.”

Kareem antes the next pot. “So you’re saying my mistake was to assume that asteroid Psyche’s composition would match whole‑Universe heavy‑element statistics?”

“Well, that was his first mistake, right, Susan?”

~~ Rich Olcott

The Name’s Not The Same

The regular Thursday night meeting of the Acme Pizza and Science Society around the big circular table at Pizza Eddie’s. Al comes in, hair afire and ready to bite the heads off tenpenny nails. “This is the last straw!” <flings down yet another astronomy magazine>. “Look at this!”

I pick up the issue. “Looks like the lead article’s about the Psyche mission to the Psyche asteroid. You got a problem with that?”

“Nah, that’s just fine, exciting even. Look at the address label.”

“Ah, I see your objection. Instead of your first name it says ‘A. I.’ like those are your initials. Are they?”

“No. Never had a middle initial until the Navy gave me ‘N‘ for ‘No middle initial‘ and I dropped that soon as I got out.”

“So where’d they get the ‘I’?”

“That’s what chafes my cheeks, Vinnie, people messing with my name. All this stuff going on these days about Artificial Intelligence which everybody calls ‘AI’ which looks too flippin’ much like Al. People have been ribbing me about it since ChatGPT hit the street. They come in here asking me for virtual coffee or wanting to know about my ALgorithms. One guy claimed I parked a driverless coffee machine back of the kitchen. But it’s not just jokes. I get calls asking for programming help with languages I never heard of. My checks have my name as Al but the bank lady gives me grief because I don’t sign them with A. I.”

“You’ve got a good point there. When someone chooses a name, that name’s important to them. I know whole families where everyone has a ‘go‑by‘ name. First class I ever taught, I opened by calling the role so I could tie names to faces. I started out calling out first names but quickly learned that most of the men and half the women went by middle names — this was in the South where that’s common but still. Anyway, I called first and middle names until I got to this one kid. He’d gone through three years of college going by ‘C-M’ until I blew his cover by asking which student was named Clyde and it was him. I don’t think he ever forgave me.”

“I know the feeling, Cathleen. None of the teachers could handle my full name. This magazine’s stupid spell‑checker musta corrected me wrong. I want a new name that doesn’t get messed up.”

“Al’s not your full name?”

“No, it’s Aloysius which I don’t like. No-one can spell it, or say it right if they see it written out. I got named after my Mom’s favorite uncle before I could vote against it. I’ve been going by Al ever since I knew better.”

“We need to figure you a new name that looks different but sounds almost the same so you’ll recognize it when we holler at you, right?”

“That’s about it, Vinnie. Whaddaya got?”

“A negative to begin with. We can rule out Hal, the killer computer in the 2001 movie. Don’t want to see our physicist here walk up for a strawberry scone and get ‘I’m afraid I can’t do that, Sy.’ Haw!”

“How about Sal?”

Eddie waves it away. “My Uncle Salvatore’s already got that. One’s enough.”

I read off Old Reliable’s screen. “Baal was a god worshipped by some of the Old Testament enemy tribes, eventually turned into Beelzebub. That won’t do. And ‘mal‘ means ‘bad‘ in Spanish.”

Resident chemist Susan giggles. “I don’t suppose you’d be happy if I greeted you with a cheery, ‘Hey, Gal‘. Oh, wait, I’ve got a Chemistry thing for us. ‘Cal‘ is the standard abbreviation for ‘calorie,’ one of the old‑time measures of heat energy before everybody settled on the joule. What do you think of ‘Cal‘? Hot and cool and rugged enough for you?”

“Hmm… I like it. ‘Cal’s Coffee‘ even has that market‑winner k’‑kuh sound like Krispy Kreme and Captain Crunch and Crispy Critters. It’s official — from now on, Cal is my official go‑by name. Thanks, Susan.”

She grins. “First time I’ve named an adult. Hi, Cal.”
 ”Hi, Cal.”
  ”Hi, Cal.”
   ”Hi, Cal. Now about that magazine article…”

Adapted from a photo by Edward Eyer

~~ Rich Olcott

Eclipse Correction

From: Robin Feder <rjfeder@fortleenj.com>
To: Sy Moire <sy@moirestudies.com>
Subj: Bad diagram

My Dad said I should write you about the bad video that is in your “Elliptically Speaking” post. It shows a circle around a blue dot that’s supposed to be the Earth, and an oval shape that’s supposed to be the Moon’s orbit around the Earth, and blinking thingies that are supposed to show what eclipses look like. I took a screen shot of the video to show you. But the diagram is all wrong because it has two places where the Moon is far away from the Earth and two places where the Moon is closer and that’s wrong. All the orbit pictures I can find in my class books show there’s only one of each. Please fix this. Sincerely, Robin Feder


From: Sy Moire <sy@moirestudies.com>
To: Robin Feder <rjfeder@fortleenj.com>
Subj: Bad Diagram

You’re absolutely correct. That’s a terrible graphic and I’ll have to apologize to Cathleen, Teena and all my readers. Thanks for drawing my attention to my mistake. When I built that animation I was thinking too much about squashed circles and not enough about orbits. I’ve revised the animation, moving the Earth and its circle sideways a bit. Strictly speaking, Earth and the Moon both orbit around their common center of gravity. Also, the COG should be at one focus of an ellipse. An ellipse has two foci located on either side of the figure’s center. However, both of those corrections for the Earth‑Moon system are so small at this scale that you wouldn’t be able to see them. I drew my oval (not a true ellipse) out of scale to make the effect more visible.

Moving the oval so that there’s only one close place and one far place (astronomers call them perigee and apogee) meant that I also had to move the blinking eclipse markers. I think the new locations do a better job of showing why we have both annular and total eclipses. You just have to imagine the Sun being beyond the Moon in each special location so that the eclipse shadow meets the Earth.

I’ve swapped out the bad diagram on the website. Here’s a screenshot of the better diagram I’ve put in its place.

Please remember to use proper eclipse-viewing eyewear when you look at this October’s annular eclipse. And give my regards to your Dad.

~~ Rich Olcott

  • Thanks to Ric Werme for gently pointing out my bogus graphic.