Intermezzo for Rubber Ruler

¡Dios mio!  Vera Rubin confirms that galaxies cluster and no-one thinks that’s important?”

“That was in the 1950s, Maria.  Her report was just a degree thesis and a minor paper.  Her advisor, who should have pushed her case but didn’t, was a cosmologist instead of an observational astronomer.  At the time, many considered cosmology to be just barely not metaphysics.  What she reported didn’t bear on what the astronomers of the day considered the Big Questions, like how do stars work and is the expansion of the Universe accelerating.”

“That’s political, ¿no?

“That’s part of how science works — if observations  look important, other people work to invalidate them.  If results look important, other people work to rebut them.  The claims that are validated and can’t be rebutted survive.  But the verifiers and rebutters only work on what their colleagues consider to be important.  Deciding what’s important is a political process.  The history of science is littered with claims that everyone dismissed as unimportant until decades later when they suddenly gained the spotlight.  Galaxy clustering is one of those cases.  All things considered, I think clustering’s initial obscurity had more to do with the current state of the science than with her being a woman.”

“So how did Vera Rubin react to the nada?”

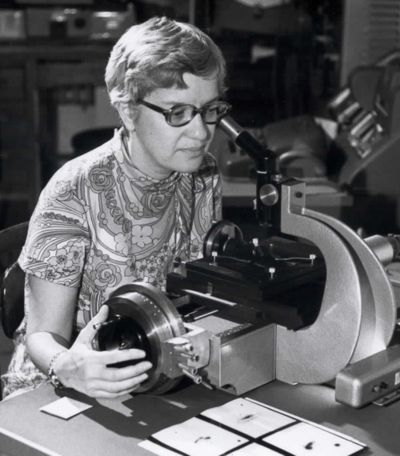
“She went back to her observing, which is what she was happiest doing anyway.  Especially when computers came along and her long-time colleague Kent Ford built a spiffy electronic spectrograph.  No more gear-calculating all day for a single number, no more peering down that measuring engine microscope tube.  Results came more quickly and she could look at larger assemblies out there in the Universe.  Which led to her next breakthrough.”

Rubin inspecting metagalaxy
“Dark matter, yes?”

“No, that came later.  This one was about streams.”

“Of water?”

“Of galaxies.  At the time, most astronomers thought that galaxy motion was a solved problem.  You know about Hubble Flow?”

“No.  Is that the streaming?”

“It’s the background for streaming.  Hubble Flow is the overall expansion of the Universe, all the galaxies moving away from each other.  But it’s not uniform motion.  We know, for instance, that the Andromeda and Milky Way galaxies are going to collide in about five billion years.  Think of galaxies like gas molecules in an expanding balloon.  On the average every molecule gets further away from its neighbors, but if you watched an individual molecule you’d see it bouncing back and forth.  Astronomers call that extra movement ‘peculiar motion.'”

“‘Peculiar’ like ‘odd?'”

“It’s an old-fashioned use of the word — ‘peculiar’ like ‘distinctive’ or ‘unique.’  Anyway, the community’s general notion was you could account for galaxy movement as a simple random motion laid on top of the Hubble Flow.”

“Again Occam’s Razor cuts too close?”

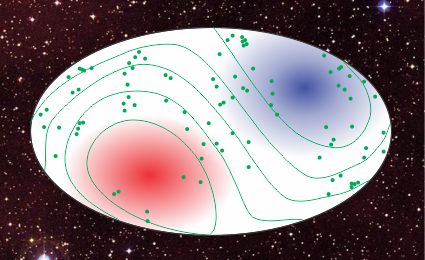
“For sure.  Rubin and Ford looked at data for almost a hundred distant galaxies all over the sky.  Not just any galaxies.  They carefully picked a set of one kind of galaxy, known in the trade as ScI, all of which have about the same ratio of absolute brightness to diameter.  Measure the diameter, you get the absolute brightness.  A distant light appears dimmer as the square of its distance.  Measure the brightness we see on Earth, make a few corrections, and the inverse square law lets you calculate how far the galaxy is from here.  Then Hubble’s distance-speed law tells you how fast you expect the galaxy to be receding.  That’s half of it.”

“OK…?”

“The other half is how fast the galaxies are really moving.  For that Rubin and Ford turned to spectroscopy.  From the red/blue-shift of each galaxy they had an independent measure of its speed relative to us.  Guess what?  They didn’t match the Hubble Flow speeds.”

Galactic velocity anisotropy
Adapted from
Astronomical Journal 81, 719-37 (1976).

“Faster or slower?”

“Both!  In one half the sky these distant galaxies appear to be fleeing faster than the Hubble Flow, and in the other half they’re going slower.  The simplest explanation is that our entire Local Group is streaming towards the ‘slowest’ part of the sky.  Rubin and company had discovered a large-scale, third kind of galactic motion — rivers of galaxies streaming through the Universe.”

“Did the people get excited?”

“Not for a while, of course.”

~~ Rich Olcott

Concerto for Rubber Ruler

An unfamiliar knock at my office door — more of a tap than a knock. “C’mon in, the door’s open.”

¿Está ocupado?

“Hi, Maria. No, I’m not busy, just taking care of odds and ends. What can I do for you?”

“I’m doing a paper on Vera Rubin for la profesora. I have the biographical things, like she was usually the only woman in her Astronomy classes and she had to make her own baño at Palomar Observatory because they didn’t have one for señoras, and she never got the Nobel Prize she deserved for discovering dark matter.

“Wait, you have all negatives there.  Her life had positives, too.  What about her many scientific breakthroughs?”

“That’s why I’m here, for the science parts I don’t understand.”

“I’ll do what I can. What’s the first one?”

“In her thesis she showed that galaxies are ‘clumped.’  What is that?”

“It means that the galaxies aren’t spread out evenly.  Astronomers at the time believed, I guess on the basis of Occam’s Razor, that galaxies were all the same distance from their neighbors.”

“Occam’s Razor?  Ah, la navaja de Okcam.  Yes, we study that in school — do not assume more than you have to.  But why would evenly be a better assumption than clumpy?”

“At the time she wrote her thesis the dominant idea was that the Big Bang’s initial push would be ‘random’ — every spot in the Universe would have an equal chance of hosting a galaxy.  But she found clusters and voids.  That made astronomers uncomfortable because they couldn’t come up with a mechanism that would make things look that way.  It took twenty years before her observations were accepted.  I’ve long thought part of her problem was that her thesis advisor was George Gamow.  He was a high-powered physicist but not an observational astronomer.  For some people that was sufficient excuse to ignore Rubin’s work.”

“Another excuse.”

“Yes, that, too.”

“But why did she have to discover the clumpy?  You can just look up in the sky and see things that are close to each other.”

“Things that appear to be close together in the sky aren’t necessarily close together in the Universe.  Look out my window.  See the goose flying there?”

“Mmm…  Yes!  I see it.”

“There’s an airplane coming towards it, looks about the same size.  Think they’ll collide?”

“Of course no.  The airplane looks small because it’s far away.”

“But when their paths cross, we see them at the same point in our sky, right?”

“The same height up, yes, and the same compass direction, but they have different distances from us.”

“Mm-hm.  Geometry is why it’s hard to tell whether or not galaxies are clustered.  Two galaxy images might be separated by arc-seconds or less.  The objects themselves could be nearest neighbors or separated by half-a-billion lightyears.  Determining distance is one of the toughest problems in observational astronomy.”

“That’s what Vera Rubin did?  How?”

“In theory, the same way we do today.  In practice, by a lot of painstaking manual work.  She did her work back in the early 1950s, when ‘computer’ was a job title, not a device.  No automation — electronic data recording was a leading-edge research topic.  She had to work with images of spectra spread out on glass plates, several for each galaxy she studied.  Her primary tool, at least in the early days, was a glorified microscope called a measuring engine.  Here’s a picture of her using one.” Vera Rubin

“She looks through the eyepiece and then what?”

“She rotates those vernier wheels to move each glass-plate feature on the microscope stage to the eyepiece’s crosshairs.  The verniers give the feature’s x– and y-coordinates to a fraction of a millimeter.  She uses a gear-driven calculating machine to turn galaxy coordinates into sky angles and spectrum coordinates into wavelengths.  The wavelengths, Hubble’s law and more arithmetic give her the galaxy’s distance from us.  More calculations convert her angle-angle-distance coordinates to galactic xy-z-coordinates.  Finally she calculates distances between that galaxy and all the others she’s already done.  After processing a few hundred galaxies, she sees groups of short-distance galaxies in reportable clusters.”

“Wouldn’t a 3-D graphic show them?”

“Not for another 50 years.”

~~ Rich Olcott

Quartetto for Rubber Ruler

Suddenly Al’s standing at our table.  “Hey guys, I heard you talking about spectroscopy and stuff and figured you could maybe ‘splain something I read.  Here’s some scones and I brought a fresh pot of coffee..”

“Thanks, Al.  What’s the something?  I’m sure Cathleen can ‘splain.”

“Syyy…”

“It’s this article talking about some scientists going down to Australia to use really old light to look for younger light and it’s got something to do with dark matter and I’m confused.”

“You’re talking about the EDGES project, right?”

“Yeah, I’m pretty sure they said ‘EDGES’ in the article.”

“OK, first we need some background on the background, that really old light you mentioned.  The Cosmic Microwave Background is the oldest light in the Universe, photons struggling out of the white-hot plasma fog that dominated most of the first 377,000 years after the Big Bang.”

“Wait a minute, ‘plasma fog’?”

“Mm-hm.  In those early years the Universe was all free electrons and nuclei colliding with photons and each other.  No photon could travel more than a few centimeters before being blocked by some charged particle.  The Universe had to expand and cool down to 4,000K or so before electrons and nuclei could hold together as atoms and the fog could lift.”

“Cathleen showed me an intensity-frequency plot for those suddenly-free photons.  It was a virtually perfect blackbody curve, identical within a couple parts per million everywhere in the sky.  The thing is, the curve corresponds to a temperature of only 2.73K.  Its peak is in the microwave region, hence the CMB moniker, nestled in between far infrared and HF radio.”

“I thought she said that the fog lifted at 4,000K, Sy.  That’s a lot different from 2-whatever.”

Wavelength-stretching, Vinnie, remember?  Universe expansion stretches the photon waves we measure temperatures with, the further the longer just like Hubble said.  The CMB’s the oldest light in the Universe, coming to us from 13.4 billion lightyears away.  The stretch factor is about 1100.”

“Vinnie, that 2.7K blackbody radiation is the background to the story.  Think of it as a spherical shell around the part of the Universe we can see.  There are younger layers inside that shell and older layers beyond it.”

“What could be outside the Universe, Cathleen?”

“Hey, Al, I carefully said, ‘the part of the Universe we can see.’  I’m quite sure that the Universe extends beyond the spatial volume we have access to, but light from out there hasn’t had a chance to get to us yet.  Going outward from our CMB sphere there’s that 337,000-year-deep shell of electron-nucleus fog.  Beyond that, 47,000 years-worth of quark soup and worse, out to the Big Bang itself.  Coming inward from the CMB we see all the things we know of that have to do with atoms.”

“Like galaxies?”

“Well, not immediately, they took a billion years to build up.  First we had to get through the Dark Ages when there weren’t any photons in the visible light range.  We had huge clouds of hydrogen and helium atoms but virtually all of them were in the ground state.  The CMB photons running around were too low-energy to get any chemistry going, much less nuclear processes.  The Universe was dark and cooling until gravitational attraction made clumps of gas dense enough to light up and become stars.  That’s when things got going.”

“How’d that make a difference?”Blackbody spectrum with notch

“A ground state hydrogen atom’s lowest available empty energy level is way above what a CMB photon could supply.  Those Dark Age atoms were essentially transparent to the prevailing electromagnetic radiation.  But when starlight came along it excited some atoms so that they could also absorb CMB light.  See the notch on the long-wavelength side of this blackbody curve?  It marks the shadow of starlit hydrogen clouds against the CMB’s glow.  The notch wavelength indicates when the absorption started.  Its position suggests that some stars lit up as early as 180 million years after the Big Bang.”

“Suggests, huh?”

“Mm-hm.  There are other interpretations.  That’s where the fun comes in, both on the theory side and the get-more-data side.  Like looking at different times.”

“Different times?”

“Every wavelength represents a different stretch factor and a different depth into the past.”

~~ Rich Olcott

Terzetto for Rubber Ruler

ruler and sodium lines“So you’re telling me, Cathleen, that you can tell how hot a star is by looking at its color?”

“That’s right, Vinnie.  For most stars their continuous spectrum is pretty close to the blackbody equation tying peak wavelength to temperature.”

“But you can’t do that with far-away stars, right, because the further they are, the more stretched-out their lightwaves get.  Won’t that mess up the peak wavelength?”

“The key is Kirchhoff’s other kinds of spectrum.”

“You’re talking the bright-line and dark-line kinds.”

“Exactly.  Each kind of spectrum comes from a different process — each is affected differently by the object in question and the environment it’s embedded in.  A continuous spectrum is all about charged particles moving randomly in response to the heat energy they’re surrounded by.  It doesn’t matter what kind of particles they are or even whether they’re positive or negative.  Whenever a particle changes direction, it twitches the electromagnetic field and gives off a wave.”

“Right — the higher the temperature the less time between twitches; the wave can’t move as far before things change so the wavelength’s shorter; any speed’s possible so you can turn that dial wherever; I got all that.  So what’s different with the bright-line and dark-line spectrums?”

Cathleen and I both blurt out, “Spectra!” at the same time and give each other a look.  We’re grown-ups now.  We don’t say, “Jinx!” to each other any more.

“Alright, spectra.  But how’re they different?”

I pick up the story.  “Like Cathleen said, continuous spectra from same–temperature stuff look identical no matter what kind of stuff’s involved because heat is motion and each particle moves as a unit  The other kinds of spectrum are about transitions within particles so they’re all about which kind of stuff.  A given kind of atom can only absorb certain wavelengths of light and it can only relax by giving off exactly the same wavelengths.  There’s no in-betweens.”

She cuts in.  “Sodium, for instance.  It has two strong lines in the yellow, at 588.995 and 589.592 nanometers.  Whether in a star or a meteor or fireworks, sodium gives off exactly those colors.  Conversely, in an interstellar cloud or in a star’s outermost layers sodium absorbs exactly those colors from any continuous-spectrum light passing through.”

I’m back in.  “And there’s the key to your unmixing question, Vinnie.  We’ve talked about frames, remember?  Your far-away star’s light-generating layers emit a continuous spectrum that describes its temperature.  If we were right next to it, that’s the spectrum we’d see.  But as you say, we’re a long way away and in our frame the light’s been stretched.  It still looks like the black-body curve but it’s red-shifted because of our relative motion.”

Cathleen’s turn.  “But if there are sodium atoms in the star’s upper layers, their absorptions will cut a pair of notches in that emitted spectrum.  It won’t be a smooth curve, there’ll be two sharp dips in it, close together, with the blue-side one twice as strong as the other one.  Easy to recognize and measure the redshift.  The blackbody peak is redshifted by exactly the same amount so with some arithmetic you’ve got the peak’s original wavelength and the star’s temperature.”

Mine.  “See, because we know what the sodium wavelengths were in the star’s frame, we can divide the dip wavelengths we measure by the rest-frame numbers we know about.  The ratios give us the star’s redshift.”

Spectrum with only blackbody and sodium 
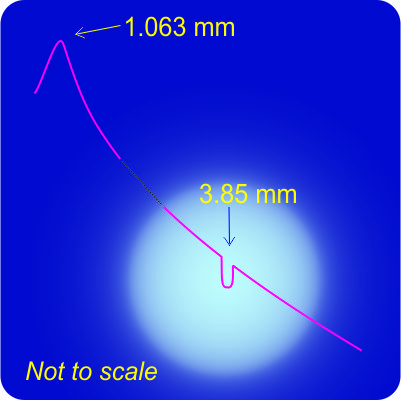
Cathleen turns to her laptop and starts tapping keys.  “Let’s do an example.  Suppose we’re looking at a star’s broadband spectrogram.  The blackbody curve peaks at 720 picometers.  There’s an absorption doublet with just the right relative intensity profile in the near infra-red at 1,060,190 and 1,061,265 picometers.  They’re 1,075 picometers apart.  In the lab, the sodium doublet’s split by 597 picometers.  If the star’s absorption peaks are indeed the sodium doublet then the spectrum has been stretched by a factor of 1075/597=1.80.  Working backward, in the star’s frame its blackbody peak must be at 720/1.80=400 picometers, which corresponds to a temperature of about 6,500 K.”

“Old Reliable calculates from that stretch factor and the Hubble Constant the star’s about ten billion lightyears away and fleeing at 240,000 km/s.”

“All that from three peaks.  Spectroscopy’s pretty powerful, huh?”

Cathleen and me: “For sure!    Jinx!”

~~ Rich Olcott