Planetary Pastry, First Course

“Morning, Al.  What’s the scone of the day?”

“No scones today, Sy.  Cathleen and one of her Astronomy students used my oven to do a whole batch of these orange-and-apricot Danishes.  Something to do with Jupiter.  Try one.”Great Apricot Spot 1
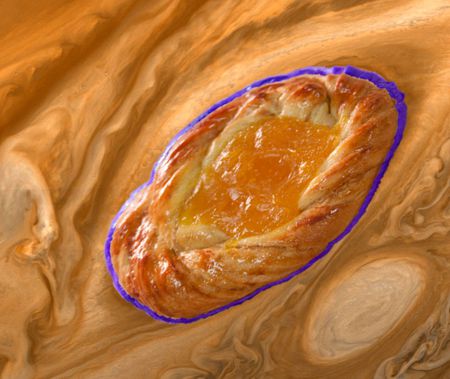
Cathleen was standing behind me.  “They’re in honor of NASA’s Juno spacecraft.  She just completed a close-up survey of Jupiter’s famous cloud formation, the Great Red Spot.  Whaddaya think?”

“Not bad.  Nice bright color and a good balance of sweetness from the apricot against tartness from the orange.”

“You noticed that, hey?  We had to do a lot of balancing — flavors, colors, the right amount of liquid.  Too juicy and the pastry part comes out gummy, too dry and you break a tooth.  Notice something else?”

“The structure, right?  Like the Spot’s collar around a mushed-up center.”

“Close, but Juno showed us that center’s anything but mushed-up.  <pulls out her smartphone>  Here’s what she sent back.”

GRS 1 @400
Credits: NASA/JPL-Caltech/SwRI/MSSS/Jason Major

“See, it’s swirls within swirls. We tried stirring the filling to look like that but it mostly smoothed out in the baking.”

“Hey, is it true what I heard that the Great Red Spot has been there for 400 years?”

“We think so, Al, but nobody knows for sure.  When Galileo published his telescopic observations of Jupiter in 1610 he didn’t mention a spot.  But that could be because he’d already caught flak from the Church by describing mountains and craters on the supposedly perfect face of the Moon.   Besides, the Jovian moons he saw were much more exciting for the science of the time.  A planet with satellites was a direct contradiction to Aristotle’s Earth-centered Solar System.”

“OK, but what about after Galileo?”

“There are records of a spot between 1665 and 1713 but then no reports of a spot for more than a century.  Maybe it was there and nobody was looking for it, maybe it had disappeared.  But Jupiter’s got one now and it’s been growing and shrinking for the past 185 years.”

“So what is it, what’s it made of and why’s it been there so long?”

“Three questions, one of them easy.”

“Which is easy, Sy?”

“The middle one.  The answer is, no-one knows what it’s made of.  That’s part of Juno‘s mission, to do close-up spectroscopy and help us wheedle what kinds of molecules are in there.  We know that Jupiter’s mostly hydrogen and helium, just like the Sun, but both of those are colorless.  Why some of the planet’s clouds are blue and some are pink — that’s a puzzle, right, Cathleen?”

“Well, we know a little more than that, especially since the Galileo probe dove 100 miles into the clouds in 1995.  The white clouds are colder and made of ammonia ice particles.  The pink clouds are warmer and … ok, we’re still working on that.”

“What about my other two questions, Cathleen?”

“People often call it a hurricane, but that’s a misnomer.  On Earth, a typical hurricane is a broad, complex ring of rainstorms with wind speeds from 75 to 200 mph.  Inside the ring wall people say it’s eerily calm.  The whole thing goes counterclockwise in the northern hemisphere, clockwise in the southern one.”

“So how’s the Great Red Spot different?”

“Size, speed, complexity, even direction.  East-to-west, the Spot is eight times wider than the biggest hurricanes.  Its collar winds run about 350 mph and it rotates counterclockwise even though it’s in Jupiter’s southern hemisphere.  It’s like a hurricane inside-out.”

“It’s not calm inside?”

“Nope, take another look at that Juno image.  There’s at least three very busy bands wrapped around a central structure that looks like it holds three distinct swirls.  That’s the part that’s easiest to understand.” GRS core

“Why so?”

“Geometry.  Adjacent segments of separate swirls have to be moving in the same direction or they’ll cancel each other out.  <scribbles diagram on a paper napkin>  Suppose I’ve got just one inside another one.  If they go in the same direction the faster one speeds up the slower one and they merge.  If they go in opposite directions, one of them disappears.  If there’s more than one inner swirl, there has to be an odd number, see?”

“So if it’s not a hurricane, what is it?”

“Got any donuts, Al?”

~~ Rich Olcott

Twinkle, Twinkle, Tabby’s Star

Al was carrying his coffee pot past our table.  “Refills?  Hey, I heard you guys talking about Tabby’s Star.  Have you seen the latest?”

“Ohmigawd, there’s more?”

“Yeah, Cathleen.  They’ve finally found something that’s periodic.”

“Catch us up, Al.  Cathleen said that the dimmings are irregular.”

“They’ve been, Sy.  But remember Cathleen’s chart that showed big dips in 2011 and 2013, about 750 days apart?  Well, guess what?”

“They’ve seen more dips at 750-day intervals, in 2015 and 2017.”

“Well, not quite.  Nobody was looking in 2015.  But Kickstarter funding let the team buy observing time in 2017.  A dip came in right on schedule.  Here’s the picture. [shows smartphone around]”

WTF 2017 peak after day 5
Visible-light photometry of Tabby’s Star
14-28 May 2017
Image from Dr Boyajian’s blog

Cathleen snorted.  “Damn shame we need crowd-funding to support Science these days.”

“True,” I agreed, “but the good news is that the support is there.  Suddenly you’re scribbling on the back of that envelope.  So what does this chart tell us?”

“I’m sure every astronomer out there will tell you, ‘It’s too soon to say anything for sure.‘  This is raw data, which means it’s hasn’t gone through the usual clean-up process to account for instrumental issues, long-term trending, things like that.  The timing is great, though.  The bottom of this dip is at 18May2017.  The first dip bottomed out 2267 days earlier on 4March2011.  Counting the 2015 case that no-one saw, there’d be three intervals from first to most recent.  2267÷3 makes the average 756 days.  Add 756 to the first date and we’re at 28Mar2013, right in the midst of that year’s complex mess.  It does fit together.”

“So whatever’s causing it has a 756-day orbit?”

“Could be.  I know your next question.  If the eclipsing material were in our Solar System, it’d be a bit outside the 687-day orbit of Mars.  But we’ve already ruled out causes near our solar system.  Tabby’s Star is about 1½ times our Sun’s mass.  That 756-day orbit around Tabby, if it is one, is maybe 30% wider than the orbit of Mars.  But.”

[both] “But?”

“But the dip profiles don’t match up from one cycle to the next.  This dip’s only 2% or so, a tenth of the ones in 2011 and 2013.  Of course, the 2013 event spanned multiple dips so Heaven knows which one we should match to.  Even 2011 and 2017 don’t look the same.  The usual quick-and-dirty way to compare dips is to pair up widths at half depth.  That statistic for 2011 is about a day.  This one is twice that or more.  If the absorber is orbiting the star, it’s changing shape and can’t be a planet.”Tabby in orbit
“So what do we got, Sy?”

“Damifino, Al.  Everything Cathleen just told us points to something like an enormous comet loaded with loose rocks that go flying along random paths away from the star.”

“Sorry, Sy, the infrared data rules out the comet dust that would have to be spewed out along with the rocks.  Besides, someone calculated just how much rocky material would be required to reproduce the dimming we’ve seen already.  You’d need a ‘comet’ somewhere between Earth-size and Jupiter-size, and maybe more than one, and with that much mass the rocks wouldn’t fly apart very well.  Oh, and there’s that long-term fading, which the comet idea doesn’t account for.”

“So we’re down to…”

[sigh] “The explanation of last resort, which astronomers are very reluctant to talk about because journalists tend to go overboard.  Maybe, just maybe, we’re witnessing an advanced civilization at work, constructing a Dyson sphere around a star 1500 light years away.  People have talked about such things for decades.  Think about it — the Sun sends out light in all directions.  Earth intercepts only a billionth of that.  If we could completely surround the Sun with solar panels we’d have access to a billion times more energy than if we covered our own planet with panels.  Better yet, it’s all renewable and producing 24 hours a day.  But even with advanced technology, panels around Tabby’s Star would still radiate in the infrared and we don’t see that.”

My smartphone chirped that same odd ringtone and it was that same odd number, 710-555-1701. “Hello, Ms Baird.”

“The Universe is not only stranger than you imagine, Mr Moire, it’s stranger than you can imagine.”

~~ Rich Olcott

Tabby’s Star — Weird Or Really Weird?

I needed some time to mull over what Cathleen had told me about Tabby’s Star, so I went to the counter to replenish our coffee and scones. When I returned I said, “OK, let’s recap.  Dr Boyajian’s Planet Hunters citizen scientists found a star that dims oddly.  But I understand there’s lots of variable stars out there.  What’s so special about this one that the SETI project got interested?”

“There’s variable stars and variable stars, but this one shouldn’t vary.  Look, one of the triumphs of 20th-century science is that we pretty much understand how stars work.  You tell me a handful of a star’s properties, things like radius, surface temperature, iron/hydrogen ratio, a couple more, and I can give you its whole life story from light-up to nova.  We’ve catalogued about 70,000 variable stars.  Virtually all of them do episodic brightening — pulsating or flaring up.  There’s about a hundred that dim more or less regularly, but they’re supergiants with cool, sooty atmospheres.  Tabby’s Star is a flat-out normal F-type main sequence star, about 1½ times the Sun’s mass and a little bit warmer.  Like the clean-cut kid next door — no reason to expect trouble from it.”

“So if it’s not the star itself that’s dimming, then something must be getting between it and us.”

“Well, yeah.  The question is what.  There’s so many theories that one pair of authors wrote a 15-page paper just classifying and rating them.”

“Gimme a few.”
Multi-Tabby Star

“Clouds of interstellar dust, for starters.  Sodium’s sparse in stars and the interstellar medium, but it’s got two easily recognized strong absorption lines in the yellow part of the visible spectrum.  Tabby’s sodium lines are broad and weak like you’d expect in a star’s atmosphere, but in the data they’re overlain by sharp, intense absorption peaks that can only come from sodium-bearing gas or dust in the nine-quadrillion-mile journey from there to here.  So there’s dispersed matter in the line of sight, but it can account for at most 35% of the dimming.  Furthermore, an interstellar cloud would have a hard time maintaining structures small enough to produce the sharp dim-and-recover pattern Boyajian found.  Loosely-bound stuff like dust clouds and gas tends to smear out in space.”

“How about comets, or rings, or clumps of asteroids orbiting the star?”

“There’s evidence against all those, but I guess I haven’t mentioned it yet.  You’ve seen the heat lamps over Eddie’s pizza bar?”

“Sure.  Infrared radiation heats things up.”

“And warm things give off infrared radiation.  ‘Warm’ meaning anything above absolute zero.  Better yet, there’s a well-known relation between an object’s temperature and its infrared spectrum.  Rocks or dust anywhere near the star would absorb energy from whatever kind of light and re-radiate it as heat infrared we could see.  The spectrum would show more infrared than you’d expect from the star itself.  And there isn’t any extra infrared.”

“None?”

“Not so’s our technology can detect.  If there’s any there, it’s less than 0.2% of the total coming from the star, nowhere near enough to account for those 8%, 16% and 22% dips.  So no, no comets or rings or asteroid clumps orbiting Tabby’s Star.”

“How about something orbiting our Sun, way far out where we’ve not found it yet?”

“Any light-blocking object near us, like maybe in the Oort Cloud that sends us long-term comets, should produce the same sort of weirdness from Tabby’s near neighbors.  We don’t see that.  One astronomer studied a star only 25 arc-seconds away — steady as a rock.  So whatever’s causing the dimming is probably close to Tabby’s star.  Oh, wait, here’s one more weirdness.  I just saw a report…” [twiddles on tablet] “Yeah, here it is.  Check out this chart.”Dimming montage“You’ll have to unravel that for me.”

“Sure.  The Planet Hunter team was looking for transits, which generally take at most a few days, so the Kepler science team filtered out slow variations before passing the data along.  After Boyajian’s report came out, two Keplerians looked back at the raw data.  I told you about the 3-6% dimming (estimates vary) since 1890.  The raw Kepler data show a 3% drop in four years!”

“I’m starting to think about Dyson Spheres and Larry Niven’s Ringworld.”

“Now you know why SETI got excited.”

~~ Rich Olcott

The Weirdest, And Naughtiest, Star in The Galaxy

It was an interesting ringtone — aggressive but feminine, with a hint of desperation.  And it was a ringtone I hadn’t programmed into my phone.  The number was intriguing, too — 710-555-1701.  It didn’t add up, so I answered the ring. “Moire here.”

“Hello, Mr Moire, this is Victoria Baird.”

It’s been a long time, Ms Baird.  What can I do for you?”  Her voice and the memory of her pointed ears sent chills down my spine.

“This time it’s what I can do for you, Mr Moire.  Here’s a tip — Tabby’s star.”  I could hear the italics.  I wanted to ask questions but the line went dead.

Considering the context, I called my Astronomy Department source.  “Morning, Cathleen.  It’s break time, can I buy you some of Al’s coffee and a scone?”

“You’re going to ask me questions, aren’t you?  What am I going to have to bone up on?  I know, it’s Tabby’s Star, right?”

“Got it in one, Cathleen.  Meet you at Al’s?”

“Yeah, give me 15 minutes.”Tabbystar 400

A quarter-hour later we had a table, two mugs of coffee and a plate of scones in front of us.  “So how’d you know I’d be asking about Tabby’s star?  And what is it?  And who is Tabby?”

“Tabby is Tabetha (she spells it with an ‘e’) Boyajian, PhD.  She teaches Astronomy at Louisiana State, does research specializing in high-precision star measurement.  In her spare time she manages a citizen-scientist project called Planet Hunters.  The Hunters get their kicks combing through databases from the Kepler satellite telescope.  They get all excited if the records indicate that a star’s been transited.”

“Oh, like that star-dimming that found the TRAPPIST-1 planets?”

“Exactly.  I think they’ve got over a hundred candidate planetary systems and a couple-dozen confirmed ones to their credit by now.  Anyhow, 2012 was a banner year for them, ’cause they raised an alert on what’s now being called the weirdest star in the galaxy.”

“Which would be Tabby’s Star.  Got it.  But what’s weird about it?”

“Poets like to write about ‘the constant stars.’  This star is world-champion not-constant.  You know how stars seem to flicker when you look at them?”

“Yeah, that’s how I tell them apart from planets.”

“Then you know that the flickering comes from starlight getting messed up going through our turbulent atmosphere.  Astronauts don’t see the flickering.  Neither does Kepler up there, so it can reliably detect miniscule variations in a star’s output.  Virtually all of the 150,000 stars it tracked for four years had rock-steady production.  A few of them occasionally dimmed or flared by maybe a percent, but Tabby’s Star (formally known as KIC 8462852) got the Hunters’ attention when it dimmed by 16%.”

“Twenty times a normal dimming!  Did it stay that way or did the light come back up again?”

“Oh, it came back all right, but the curve on the way up didn’t match the curve on the way down.  That was even weirder.  So the team scoured through the star’s 4-year record and found a dozen events on the 0.05-2% scale, plus one at 8% and another at 21%.”

“21%?  That’s a big shadow.”

“Ya think?  Especially since the between-event timing was seriously irregular and some of those events were complex with three or more separate components.  But that’s not all the weirdness. Those dips lasted for hours or even days, longer than most planetary transits.  After Boyajian and her 48 collaborators published their initial report, which has to have one of the naughtiest titles in the astronomical literature, some other —”

“Wait, a naughty title?  C’mon, don’t tease.”

“OK <sigh>.  The technical term for a star’s light output is flux.  That paper was half about the observations and half about what might be causing the variation.  Assuming the star’s real output is constant, the question becomes, ‘What happened to that missing light?‘  Or as the authors put it, ‘Where’s The Flux?‘  Since then both the paper and the star have been informally referred to as WTF.  OK?”

“OK <sigh>.  So you were saying there’s something else.”

“Yeah.  Some other astronomers went digging in the archives.  WTF has been dimming gradually for at least the past 100 years.  Weird, eh?”

“Yeah.  So what’s causing it?”

“We don’t even have good guesses.”

~~ Rich Olcott

How Many Ways Can You Look at The Sky?

Cathleen and I were discussing her TRAPPIST-1 seminar in Al’s coffee shop when a familiar voice boomed over the room’s chatter.

“Hey, Cathleen, I got questions.”

“Vinnie?”

“Yeah, Sy, he hangs out with the Astronomy crew sometimes.  You know him, too, huh?”

“From way back.  Long story.”

“What’re your questions, Vinnie?”

“I missed the start of your talk, Cathleen, but why so much hype about this TRAPPIST-1 system?  We’ve already found 3,500 stars with planets, right, and some of them have several.  What’s so special here?”

“You’re right, Vinnie, Kepler-90 has seven planets, just like TRAPPIST-1. (brandishes a paper napkin)  But that star’s more than 60 times further from us than TRAPPIST-1 is.  It’s just too far away for us to be able to learn much more about the planets than their masses and orbital characteristics.  This new system’s only 40 lightyears away, close enough that we’ve got a hope of seeing what’s in the planetary atmospheres.”

(another paper napkin)  “That ties in with the second thing that’s special.  The star’s surface temperature, 2550ºK, is so low that even though its planets orbit very close in, three of them are probably in the Goldilocks Zone.  They’re not too hot and not too cold for liquid water to exist on their surface.  IF there’s liquid water on one of them and IF there’s something living there, we should be able to detect traces of that biochemistry in the planet’s atmosphere.”

Star demographics
Observational data (dots) and four different models
of star count (vertical axis) versus temperature.
Hotter stars are to the left.

(napkin #3)  “The third special thing is that TRAPPIST-1 is the first-known planet-hosting star in its category — ultra-cool dwarf stars burning below 2700°K.  Finding those stars is hard — they’re small and dim.  No-one really knows how many there are compared to the other categories.  Some models say they should be rare, other models suggest they could be as common as G-type stars like our Sun.  IF there’s lots of ultra-cool dwarfs and IF they generally have planets like G-type stars do, then the category’s a new prime target for exoplanet hunters seeking life-signs.”

“Why’s that?”

“Because it’s easier to spot a small planet around a small star than around a big one.  Transits across TRAPPIST-1 dim its light by 1% or so.  A TRAPPIST-1 planet transiting our Sun would dim it by 1/100th of that.  The same problem hinders planet-finding methods fishing for stars that wobble because a planet’s orbiting around it.”

“Alright, I get that TRAPPIST-1 is special.  My other question is, I heard the part of your talk where you figured the odds on seeing its transits, but you lost me with the word steradian.  My dictionary says that’s an area on a sphere divided by the square of the sphere’s radius. What would that get me?  Where’d your numbers come from?”

“You need one additional piece of information.  If you take any sphere’s total surface area and divide that by r², you’ll always get 4π steradians.  You can use that to convert between absolute surface area and fraction of the sphere.  Mmm…  Sy, you own some land outside of town, yes?”

“A little.”

“And you have mineral rights?”

“Oh, yeah, that’s why I bought it.”

“And they go how far down?”

“All the way to the center of the Earth.”

“So your claim’s actually a pyramid 6370 kilometers deep.  When I moved here I learned it’s impolite to ask how much land someone has.  For round numbers I’ll assume 40 acres, which is about 1,000 square meters.  (tapping keys on her smartphone)  The Earth’s radius is 6.37×10⁶ meters, so Sy’s claim is 1,000/(6.37×106)2 = 2.47×10⁻¹¹ steradians.  Divide 4π by that and you get … 5.08×10¹¹.  So Earth’s entire surface has room for 5.08×10¹¹ patches matching Sy’s.  Visualize 5.08×10¹¹ pyramids pointing in every direction from Earth’s center.  Now extend each pyramid outward to define a separate patch of sky.  Got that picture, Vinnie?”viewing cones

“Sort of.”

“TRAPPIST-1 is 3.74×10¹⁷ meters away.  TRAPPIST-1h’s orbit is a near-circle whose radius is 9.45×10⁹ meters.  It covers π(9.45×10⁹)2/(3.74×1017)2 = 2.00×10⁻¹⁵ steradians on a sphere centered on us. Divide 4π by 2.00×10-15 …  6.27×10¹⁵ sky-patches the size of TRAPPIST-1h’s orbit.  They had to pick the right patch to find TRAPPIST-1.”

“Long odds.”

“Yep.”

~~ Rich Olcott

The Luck o’ The (insert nationality here)

“Afternoon, Al.  What’s the ruckus in the back room?”

“Afternoon, Sy.  That’s the Astronomy crew and their weekly post-seminar coffee-and-critique session.  This time, though, they brought their own beer.  You know I don’t have a beer license, just coffee, right?  Could you go over there and tell ’em to keep it covered so I don’t get busted?”

“Sure, Al.  … Afternoon, folks.  What’s all the happy?”

“Hey, Sy, welcome to the party.  Trappist beer, straight from Belgium!”

“Don’t mind if I do, Cathleen, but Al sure would like for you to put that carton under the table.  Makes him nervous.”

“Sure, no problem.”

“Thanks.  I gather your seminar was about the new seven-planet system.  How in the world do the Trappists connect to that story?”

“Patriotism.  The find was announced by a team from Belgium’s University of Liege.  They’ve built a pair of robotic telescopes tailored for seeking out rocks and comets local to our Solar System.  Exoplanets, too.  Astronomers love tying catchy acronyms to their projects.  This group’s proudly Belgian so they called their robots TRAnsiting Planets and Planetesimals Small Telescopes, ergo TRAPPIST, to honor the country’s 14 monasteries.  And their beer.  Mainly the beer, I’ll bet.”

“So the planets are a Belgian discovery?”

“Well, the lead investigator, Michaël Gillon, is at Liege, and so are half-a-dozen of his collaborators.  Their initial funding came from the Belgian government.  But by the time the second paper came out, the one that claimed a full seven planets spanning a new flavor of Goldilocks Zone, they’d pulled in support and telescope time from over a dozen other countries — USA, India, UK, France, Morocco, Saudi Arabia… the list goes on.  So it’s Belgian mostly but not only.”

“I love international science.  Next question — I see the planets are listed as TRAPPIST-1b, TRAPPIST-1c, and so on up to TRAPPIST-1h.  What happened to TRAPPIST-1a?”

“Rules of nomenclature, Sy.  TRAPPIST-1a is the star itself.  Actually, the star already had a formal name, which I just happen to have written down in my seminar notes somewhere … here it is, 2MASS J23062928 – 0502285.  You can see why TRAPPIST-1 is more popular.”

“I’m not even going to ask how that other name unwinds.  So what was the seminar topic this week?”

7 planets
TRAPPIST-1’s planets,
drawn to scale against their star. The
green ones are in the Goldilocks Zone.

“The low probability for us ever noticing those planets blocking the star’s light.”

“I’d think seeing a star winking on and off like it’s sending Morse code would attract attention.”

“That’s not close to what it was doing.  It’s all about the scale.  You know those cartoons that show planets together with their host sun?”

(showing her my smartphone) “Like this one?”

“Yeah.  It’s a lie.”

“How is it lying?”

“It pretends they’re all right next to the star.   7 planets perspective
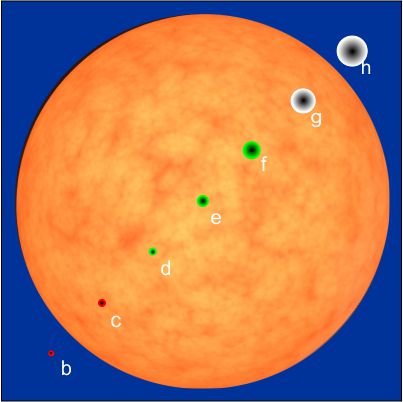
This image is a little better.”  (showing me her phone)  “This artist at least tried to build in some perspective.  Even in this tiny solar system, about 1/500 the radius of ours, the star’s distance to each planet is hundreds to a thousand times the size of the planet.  You just can’t show planets AND their orbits together in a linear diagram.  Now, think about how small these planets are compared to their sun.”

“Aaaa-hah!   When there’s an eclipse, only a small fraction of the light is blocked.”

“That’s part of it.  Each eclipse (we call them transits) dims the measured brightness by only a percent or so.  But it’s worse than that.”

eclipses“How so?”

“All those orbits lie in a single plane.  We can’t see the transits unless our position lines up with that plane.  If we’re as little as 1½° out of the plane, we miss them.  But it’s worse than that.”

“How so?”

“During a transit, each planet casts a conical shadow that defines a patch in TRAPPIST-1’s sky.  You can tile TRAPPIST-1’s sky with about 150,000  patches that size.  There’s one chance in 150,000 of being in the right patch to see that 1% dimming.  In our sky there are over 6×10¹⁵ patches the size of TRAPPIST-1h’s orbit.  The team had to inspect the just right patch to find it.”

“With odds like that, no wonder TRAPPIST uses robots.”

“Yep.”

~~ Rich Olcott

Hoppin’ water molecules

chladny-2Before you get any further in this post, follow this link to Steve Mould’s demonstration of  Chladni figures.  (I’ll wait here.)  It’s a neat demo and the effect plays into some recent discoveries in planetary science.

Steve’s couscous grains dance to the vibrations of the iron plate they’re sitting on.  The patterns happen because he controls where those vibrations happen.  Or more importantly, don’t happen (see his fingers pinching the plate?).

The study of vibration goes back to Pythagoras, the ancient Greek geek who determined that a plucked stretched string invariably exhibits a whole number of peaks and nodes.  (A node is a point on the string that doesn’t move, like those dots on the chart).  I’m so tempted to yammer about the relationship between nodes and quantum mechanics, but I’ve already posted on that topic.sines

The important point for this post is that Steve’s demonstration shows individual particles, each moving under the influence of random impacts, nonetheless winding up at a common destination.  They’re repeatedly kicked away from points where the iron plate is fluctuating strongly.  If a particle suddenly finds itself on a non-fluctuating nodal point (or nodal line, which is just a collection of nodal points), it stays there because why not?

The basic principle applies to numerous phenomena in Physics, Chemistry and other Sciences.  The particles in Chladni’s experiment were grains of sand.  Steve used coucous grains, which work better in video.  But they could also be molecules.  On the Moon.

Back in the 2000s there was intense debate in the lunar astronomy community.  One argument went, “The Solar Wind teems with hydrogen ions (H+).  The Moon’s surface rocks are mostly silicon oxides.  Those H+ ions will yank oxygen O2- ions off exposed rocks to make H2O molecules.  There has to be water on the Moon!”

The other side of the argument (in real Science there’s always at least one other side) went, “Maybe so, but Solar radiation also contains high-energy electrons and photons that’ll rip those molecules apart.  Water can’t survive up there!”

If/when we plant a Moon colony, the colonists will need water.  Either it gets shipped up from Earth — EXPENSIVE — or we find and mine water up there.  NASA did the only thing that could be done — they sent up a spacecraft for a close look.   When the Lunar Reconnaissance Orbiter (the LRO) launched in 2009 it carried half-a-dozen instruments.  One of them was the Lyman Alpha Mapping Project (LAMP) camera.

LAMP was the embodiment of a sly trick.  Buried in starlight’s ultraviolet spectrum are photons (a.k.a. Lyman-α  light) with a wavelength of 121.6 nanometers.  They’re generated by excited hydrogen atoms and they’re (mostly) absorbed by hydrogen atoms but reflected by rock that doesn’t contain hydrogen.

LAMP’s camera was designed to be sensitive to just those Lyman-α photons.  As LRO circled the Moon, the LAMP camera recorded what fraction of those special photons was bouncing off the Moon.  By subtraction, it told us  what fraction was being absorbed by surface hydrogen.

LAMP did find water.  The fun facts are its form and location — it was frost, buried in “fluffy soils” in the walls of craters.
water-moonThis photo, part of the LAMP exhibit at the Denver Museum of Nature and Science, shows why.  It’s a model of a cratered Moon lit by sunlight.

An H2O molecule may develop anywhere on the Moon’s surface.  Then it experiences life’s usual slings and arrows (well, electrons and photons) that might blast it apart or might merely give it a kinetic kick to somewhere else.  That process continues until the molecule or a descendant drops into a nice shady crater.

The best craters would be the ones in the polar regions, where sunlight arrives at a low angle and the crater walls are permanently shadowed like the one at the top in the model.  That’s exactly were LAMP found the most dark spots.  HAH —  Chladni in space!

But there’s more.  In 2012, NASA’s MESSENGER spacecraft produced evidence for water on Mercury, the hottest planet in the Solar System.  Once again, those molecules were hiding in polar craters along with a few other surprising molecular species.  That knocked my socks off when I read the scientific report.

~~ Rich Olcott

Michelson, Morley and LIGO

Two teams of scientists, 128 years apart.  The first team, two men, got a negative result that shattered a long-standing theory.  The second team, a thousand strong, got a positive result that provided final confirmation of another long-standing theory.  Both teams used instruments based on the same physical phenomenon.  Each team’s innovations created whole new fields of science and technology.

Interferometer 1
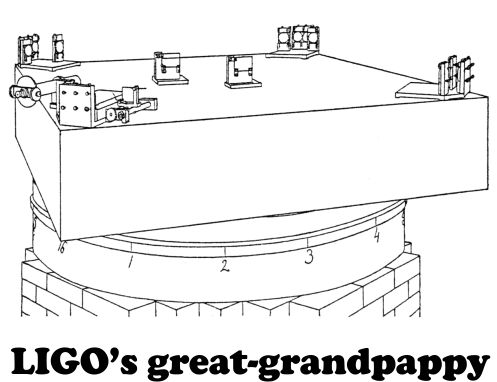
Their common experimental strategy sounds simple enough — compare two beams of light that had traveled along different paths

Light (preferably nice pure laser light, but Albert Michelson didn’t have a laser when he invented interferometry in 1887) comes in from the source at left and strikes the “beam splitter” — typically, a partially-silvered mirror that reflects half the light and lets the rest through.  One beam goes up the y-arm to a mirror that reflects it back down through the half-silvered mirror to the detector.  The other beam goes on its own round-trip journey in the x-direction.  The detector (Michelson’s eye or a photocell or a fancy-dancy research-quality CCD) registers activity if the waves in the two beams are in step when they hit it.  On the other hand, if the waves cancel then there’s only darkness.

Getting the two waves in step requires careful adjustment of the x- and y-mirrors, because the waves are small.  The yellow sodium light Michelson used has a peak-to-peak wavelength of 589 nanometers.  If he twitched one mirror 0.0003 millimeter away from optimal position the valleys of one wave would cancel the peaks of the other.

So much for principles.  The specifics of each team’s device relate to the theory being tested.  Michelson was confronting the æther theory, the proposition that if light is a wave then there must be some substance, the æther, that vibrates to carry the wave.  We see sunlight and starlight, so  the æther must pervade the transparent Universe.  The Earth must be plowing through the æther as it circles the Sun.  Furthermore, we must move either with or across or against the æther as we and the Earth rotate about its axis.  If we’re moving against the æther then lightwave peaks must appear closer together (shorter wavelengths) than if we’re moving with it.Michelson-Moreley device

Michelson designed his device to test that chain of logic. His optical apparatus was all firmly bolted to a 4′-square block of stone resting on a wooden ring floating on a pool of mercury.  The whole thing could be put into slow rotation to enable comparison of the x– and y-arms at each point of the compass.

Interferometer 3
Suppose the æther theory is correct. Michelson should see lightwaves cancel at some orientations.

According to the æther theory, Michelson and his co-worker Edward Morley should have seen alternating light and dark as he rotated his device.  But that’s not what happened.  Instead, he saw no significant variation in the optical behavior around the full 360o rotation, whether at noon or at 6:00 PM.

Cross off the æther theory.

Michelson’s strategy depended on light waves getting out of step if something happened to the beams as they traveled through the apparatus.  Alternatively, the beams could charge along just fine but something could happen to the apparatus itself.  That’s how the LIGO team rolled.

Interferometer 2
Suppose Einstein’s GR theory is correct. Gravitational wave stretching and compression should change the relative lengths of the two arms.

Einstein’s theory of General Relativity predicts that space itself is squeezed and stretched by mass.  Miles get shorter near a black hole.  Furthermore, if the mass configuration changes, waves of compressive and expansive forces will travel outward at the speed of light.  If such a wave were to encounter a suitable interferometer in the right orientation (near-parallel to one arm, near-perpendicular to the other), that would alter the phase relationship between the two beams.

The trick was in the word “suitable.”  The expected percentage-wise length change was so small that eLIGO needed 4-kilometer arms to see movement a tiny fraction of a proton’s width.  Furthermore, the LIGO designers flipped the classical detection logic.  Instead of looking for a darkened beam, they set the beams to cancel at the detector and looked for even a trace of light.

eLIGO saw the light, and confirmed Einstein’s theory.

~~ Rich Olcott

Three LIGOs make a Banana Slicer

Ponder for a moment what Space throws at you.  Photons of all sizes, of course —  infra-red ones that warm your skin, visible ones that show you the beach, ultra-violet ones that give you tan and sunburn.  Neutrinos and maybe dark matter particles that pass right through you without even pausing.  All of those act upon you in little bits at little places — gravity pervades you.  You can put up a parasol or step into a cave, but there’s no shielding yourself from gravity.

Gravity’s special character has implications for LIGOs.  A word first about words.  LIGO as a generic noun unwinds to Laser Interferometer Gravitational-Wave Observatory, a class of astronomical instruments. LIGO as a proper noun denotes a project that culminated in the construction of a specific pair of devices that went live in 2002.

That hardware wasn’t sensitive enough to detect the gravitational waves it was created to seek.  To improve the initial LIGO’s power and sensitivity, the LIGO infrastructure and organization morphed into the Advanced LIGO (aLIGO) project.  Concurrently, the LIGO instrument was upgraded and renamed.  No surprise, the instrument’s new name is aLIGO.  An early phase of aLIGO bore uncannily fortunate fruit with the Sept 14 gravitational wave detection.

Four other LIGOs are proposed, under construction or in operation around the world — KARGA in Japan, INDIGO in India, GEO600 in Germany and VIRGO in Italy.  Why so many, and why even consider space-borne LIGOs like LISA Pathfinder and eLISA?

Astronomers ask a series of questions of the Universe:

  • What objects are out there?
  • Where are they?
  • What are they doing?
  • Why are they doing that?

September’s aLIGO incident gave us a gratifyingly unexpected answer to the first question.  To the surprise of theoreticians, the detected event was the collision of two black holes, each of which was in a size range that current theory says shouldn’t be populated.  Even more surprising, such objects are apparently common enough to meet up, form binary pairs and eventually merge.

1 LIGO localizationThe second question is harder.  The best the aLIGO team could do was point to a “banana-shaped region” (their words, not mine) that covers about 1% of the sky.  The team marshaled a world-wide collaboration of observatories to scan that area (a huge search field by astronomical standards), looking for electromagnetic activities concurrent with  the event they’d seen.  Nobody saw any.  That was part of the evidence that this collision involved two black holes.  (If one or both of the objects had been something other than a black hole, the collision would have given off all kinds of photons.)

Why such poor localization?  Blame gravity’s pervasive character and Geometry.  With a telescope, any kind of telescope, you know which direction you’re looking.  Telescopes work only with photons that enter through the front; photons aimed at the back of the instrument stop there.

2 LIGO localizationIn contrast, a LIGO facility is (roughly speaking) omni-directional.  When a LIGO installation senses a gravitational pulse, it could be coming down from the visible sky or up through the Earth from the other hemisphere — one signal doesn’t carry the “which way?” information.  The diagram above shows that situation.  (The “chevron” is an image of the LIGO in Hanford WA.)  Models based on the signal from that pair of 4-km arms can narrow the source field to a “banana-shaped region,” but there’s still that 180o ambiguity.

The good news is that the LIGO project built not one but two installations, 2500 miles apart.  With two LIGOs (the second diagram) there’s enough information to resolve the ambiguity.  The two also serve as checks on each other — if one sees a signal that doesn’t show up at the other that’s probably a red herring that can be discarded.

3 LIGO localizationThe great “if only” is that the VIRGO installation in Italy was not recording data when the Hanford WA and Livingston LA saw that September signal.  With three recordings to reconcile, the aLIGO+VIRGO combination would have had enough information to slice that banana and localize the event precisely.

When the European Space Agency puts Evolved LISA (eLISA) in orbit (watch the animation, it’s cool) in 2034, there’ll be a million-kilometer triangle of spacecraft up there, slicing bananas all over the sky.

~~ Rich Olcott

aLIGO and eLISA: Tuning The Instrument

Oh, it’s good to see Big News in hard science get big attention in Big Media.  The LIGO story and Columbia’s Dr Brian Greene even made it to the Stephen Colbert Late Show.  Everyone chuckled at the final “boowee-POP” audio recording (simulation at 7:30 into this clip; get for-real traces and audio from this one).

There’s some serious science in those chirps, not to mention serious trouble for any alien civilization that happened to be too close to the astronomical event giving rise to them.

LIGO trace 3
Adapted from the announcement paper by Abbot et al

The peaks and valleys in the top LIGO traces represent successive spatial compression cycles generated by two massive bodies orbiting each other.  There’s one trace for each of the two LIGO installations.  The spectrograms beneath show relative intensity at each frequency.  Peaks arrived more rapidly in the last 100 milliseconds and the simulated sound rose in pitch because the orbits grew smaller and faster.  The audio’s final POP is what you get from a brief but big disturbance, like the one you hear when you plug a speaker into a live sound system.  This POP announced two black holes merging into one, converting the mass-energy of three suns into a gravitational jolt to the Universe.

Scientists have mentioned in interviews that LIGO has given us “an ear to the Universe.”  That’s true in several different <ahem> senses.  First, we’ve seen in earlier posts that gravitational physics is completely different from the electromagnetism that illuminates every kind of telescope that astronomers have ever used.  Second, black hole collisions generate signals in frequencies that are within our auditory range.  Finally, LIGO was purposely constructed to have peak sensitivity in just that frequency range.

Virtually every kind of phenomenon that physicists study has a characteristic size range and a characteristic frequency/duration range.  Sound waves, for instance, are in the audiophile’s beloved “20 to 20,000” cycles per second (Hz).  Put another way, one cycle of a sound wave will last something between 1/20 and 1/20,000 second (0.05-0.000 05 second).  The speed of sound is roughly 340 meters per second which puts sound’s characteristic wavelength range between 17 meters and 17 millimeters.

No physicist would be surprised to learn that humans evolved to be sensitive to sound-making things in that size range.  We can locate an oncoming predator by its roar or by the snapping twig it stepped on but we have to look around to spot a pesky but tiny mosquito.

So the greenish box in the chart below is all about sound waves.  The yellowish box gathers together the classes of phenomena scientists study using the electromagnetic spectrum.  For instance, we use infra-red light (characteristic time range 10-15-10-12 second) to look at (or cause) molecular vibrations.

RegimesWe can investigate things that take longer than an instrument’s characteristic time by making repeated measurements, but we can’t use the instrument to resolve successive events that happen more quickly than that.  We also can’t resolve events that take place much closer together than the instrument’s characteristic length.

The electromagnetic spectrum serves us well, but it has its limitations.  The most important is that there are classes of objects out there that neither emit nor absorb light in any of its forms.  Black holes, for one.  They’re potentially crucial to the birth and development of galaxies.  However, we have little hard data on them against which to test the plethora of ideas the theoreticians have come up with.

Dark matter is another.  We know it’s subject to gravity, but to our knowledge the only way it interacts with light is by gravitational lensing.  Most scientists working on dark matter wield Occam’s Razor to conclude it’s pretty simple stuff.  Harvard cosmologist Dr Lisa Randall has suggested that there may be two kinds, one of which collects in disks that clothe themselves in galaxies.

That’s where LIGO and its successors in the gray box will help.  Their sensitivity to gravitational effects will be crucial to our understanding of dark objects.  Characteristic times in tens and thousands of seconds are no problem nor are event sizes measured in kilometers, because astronomical bodies are big.

GrWave Detectors
Gravitational instrumentation, from Christopher Berry’s blog and Web page

This is only the beginning, folks, we ain’t seen nothin’ yet.

~~ Rich Olcott