The Trough And The Plateau

Particularly potent pepperoni on Pizza Eddie’s special tonight so I dash to the gelato stand. “Two dips of pistachio in a cup, please, Jeremy, and hurry. Hey, why the glum look?”

“The season’s moving so slowly, Mr Moire. I’m a desert kid, used to bright skies. I need sunlight! We’re getting just a few hours of cloudy daylight each day. It seems like we’re never gonna leave this pattern. Here’s your gelato.”

“Thanks. Sorry about the cloudiness, it’s the wintertime usual around here. But you’re right, we’re on a plateau.”

“Nosir, the Plateau’s the Four Corners area, on the other side of the Rockies, miles and miles away from here.”

<chuckle> “Not the Colorado Plateau, the darkness plateau. Or the daylight trough, if you prefer. Buck up, we’ll get a daylight plateau starting in a few months.” <unholstering Old Reliable> “Here’s a plot of daylight hours through the year at various northern latitudes. We’re in between the red and green curves. For folks south of the Equator that’d just turn upside‑down, of course. I added a star at today’s date in mid‑December, see. We’re just shy of the winter solstice; the daylight hours are approaching the minimum. You’re feeling stressed because these curves don’t change much day-to-day near minimum or maximum. In a couple of weeks the curve will bend upwards again. Come the Spring equinox, you’ll be shocked at how rapidly the days lengthen.”

“Yeah, my Mom says I’m too impatient. She says that a lot. Okay, above the Arctic Circle they’ve got months‑long night and then months‑long day, I’ve read about that. I hadn’t realized it was a one‑day thing at the Circle. Hey, look at the straight lines leading up to and away from there. Is that the Summer solstice? Those low‑latitude curves look like sine waves. Are they?”

“Summer solstice in the northern hemisphere, Winter solstice for the southerners. The curves are distorted sines. Ready for a surprise?”

<Looks around the nearly empty eatery.> “With business this slow I’m just sitting here so I’m bored. Surprise me, please.”

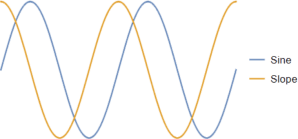
“Sure. One of the remarkable things about a sine wave is, when you graph its slopes you get another sine wave shifted back a quarter. Here, check it out.”

“Huh! When the sine wave’s mid-climb, the slope’s at its peak. When the sine wave’s peaking, the slope’s going through zero on the way down. And they do have exactly the same shape. I see where you’re going, Mr Miore. You’re gonna show me the slopes of the daylight graphs to see if they’re really sine waves.”

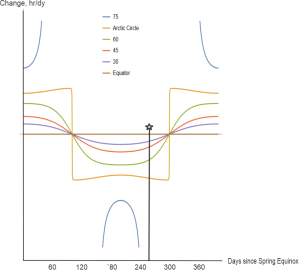
“You’re way ahead of me and Old Reliable, Jeremy.” <frantic tapping on OR’s screen> “There, point‑by‑point slopes for each of the graphs. Sorta sine‑ish near the Equator but look poleward.”

“The slopes get higher and flatter until the the Arctic Circle line suddenly drops down to flip its sign. Those verticals are the solstices, right?”

“Right. Notice that even at the Circle the between‑solstice slopes aren’t quite constant so the straight lines you eye‑balled aren’t quite that. North of the Circle the slopes go nuts because of the abrupt shifts between varying and constant sun.”

“How do you get these curves, Mr Moire?”

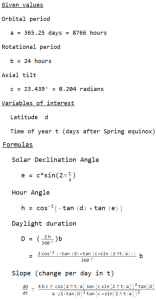
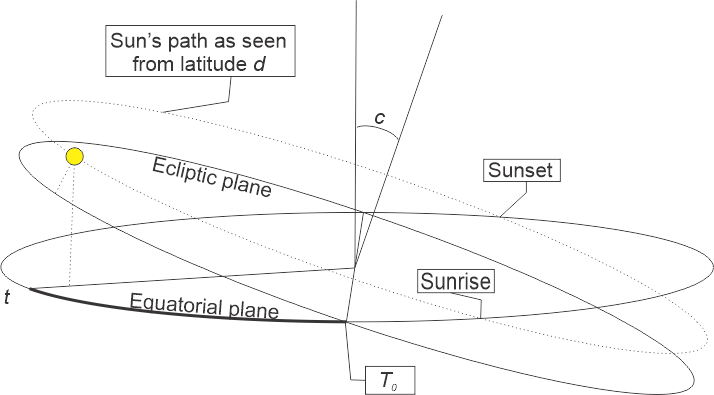
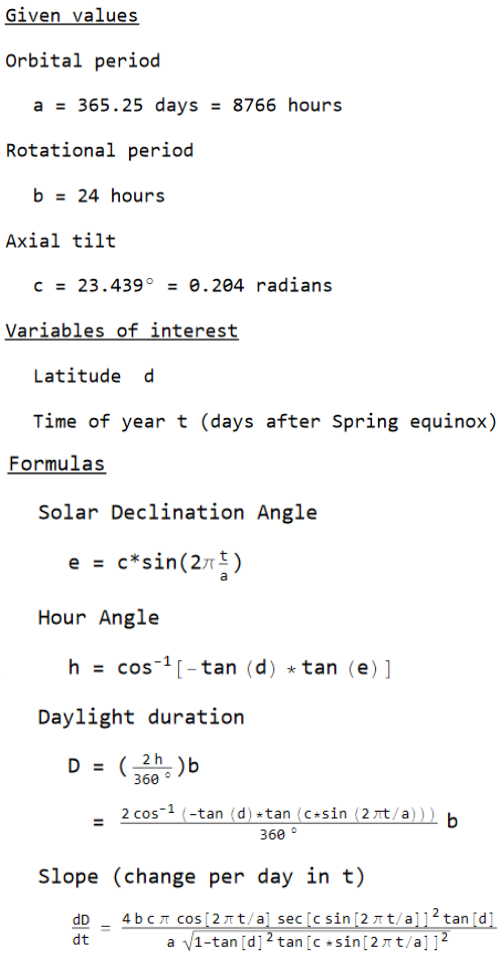
“It’s a series of formulas. Dust off your high school trig. The Solar Declination Angle equation is about the Sun’s height above or below the horizon. It depends on Earth’s year length, its axial tilt and the relative date, t=T‑T0. For these charts I set T0 to the Spring equinox. If the height’s negative the Sun’s below the horizon, okay?”

“Sine function is opposite‑over‑hypotenuse and the height’s opposite alright or we’d burn up, yup.”

“The second formula gives the the Hour Angle between your longitude and whichever longitude has the Sun at its zenith.”

“Why would you want that?”

“Because it’s the heart of the duration formula. When you roll all three formulas together you get one big expression that gives daylight duration in terms of Earth’s constants, time of year and your location. That’s what I plotted.”

“How about the slope curves?”

“Calculus, Jeremy, d/dt of that combined duration function. It’s beyond my capabilities but Old Reliable’s up to it.”

~ Rich Olcott

Caged But Free

Afternoon coffee time. Cal waves a handful of astronomy magazines at us as Cathleen and I enter his shop. “Hey, guys, there’s a ton of black hole stuff in the news all of a sudden.”

Cathleen plucks a scone from the rack. “Not surprised, Cal. James Webb Space Telescope looks harder and deeper than we ever could before and my colleagues have been feasting on the data. Black holes are highly energetic so the most extreme ones show up well. The Hubble and JWST folks find new extremes every week.”

Cal would be disappointed if I didn’t ask. “So what’s the new stuff in there?”

<flipping through the magazines> “This seems to be quasar jet month. We’ve got a new champion jet and this article says M87’s quasar makes novas.”

“Remind me, Cathleen, what’s a quasar?”

“A quasi‑stellar object, Sy, except we now know it’s a galaxy with a supermassive black hole—”

“I thought they all had super‑massives.”

“Most do, but these guys are special. For reasons researchers are still arguing about, they emit enormous amounts of energy, as much as a trillion average stars. Quasar luminosity is more‑or‑less flat all across the spectrum from X-rays down as low as we can measure. Which isn’t easy, because the things are so far away that Universe expansion has stretched their waves by z‑factors of 6 or 8 or more. We see their X‑ray emissions in the infrared range, which is why JWST’s optimized for infrared.”

“What does ‘flat’ tell you?”

“Sy’d give a better answer than I would. Sy?”

“Fun fact, Cal. Neither atoms nor the Sun have flat spectra and for the same reason: confinement. Electromagnetic waves come from jiggling charges, right? In an atom the electron charge clouds are confined to specific patterns centered on the nucleus. Each pattern holds a certain amount of energy. The atom can only move to a different charge pattern by emitting or absorbing a wave whose energy matches the difference between the pattern it’s in and some alternate pattern. Atomic and molecular spectra show peaks at the energies where those transitions happen.”

“But the Sun doesn’t have those patterns.”

“Not in the stepped energy‑difference sense. The Sun’s made of plasma, free electrons and nuclei all bouncing off each other, moving wherever but confined to the Sun’s spherical shape by gravity. Any particle that’s much more or less energetic than the local average eventually gets closer to average by exchanging energy with its neighbors. Free charged particles radiate over a continuous, not stepwise, spectrum of energies. The free‑particle combined spectrum has a single peak that depends on the average temperature. You only get flat spectra from systems that aren’t confined either way.”

“What I get from all that is a jet’s flat spectrum says that its electrons or whatever aren’t confined. But they must be — the things are thin as a pencil for thousands of lightyears. Something’s gotta be holding them together but why no peaks?”

“Excellent question, Cal. By the way, jets can be even longer than you said. I’ve read about your champion jet. It extends 23 million lightyears, more than a hundred times the width of the Milky Way galaxy. Straight as a string, no kinks or wiggles during a billion years of growth. I think what’s going on is that the charged particles are confined side‑to‑side somehow but they’re free to roam along the jet’s axis. If that’s the case, the flat‑spectrum light ought to be polarized. I’m sure someone is working on that test now. Your thoughts, Sy?”

“As a physicist I’m interested in the ‘somehow.’ We only know of four forces. The distances are too big for weak and strong nuclear forces. Gravity’s out, too, because it acts equally in all directions, not just crosswise to the axis. That leaves electromagnetic fields in some super‑strong self‑reinforcing configuration. The particles must be spiraling like mad about that central axis. I’ll bet that explains Cal’s quasar galaxy concentrating novae close to its SMBH jet axis. A field that strong could generate enough interference to wreak havoc on an unstable star’s plasma.”

Hubble’s view of the M87 galaxy and jet
Credit NASA and the Hubble Heritage Team (STScI/AURA)

~ Rich Olcott

The Oldest Clock Ticks Slowest

<Cliff‑hanger Cathleen strikes again> “How can you even measure a 2million year halflife?”

Kareem’s right back at her. “What’s a halflife?”

“Start a clock, weigh a sample, wait around for a while and then weigh it again to see how much is still there. When half of it’s gone, stop the clock and you’ve measured a half‑life. Simple.”

“Simple but not that simple or maybe a bit simpler. For one thing, you don’t have to wait for a full halflife. For spontaneous radioactivity, all you have to know is the interval and whatever fraction disappeared. There’s a nice equation that ties those two to the halflife.”

“Spontaneous? Like there’s another kind?”

“Stimulated radioactivity. That’s what nuclear reactors do — spew neutrons at uranium235 atoms, for instance, transmuting them to uranium236 so they’ll split into krypton and barium atoms and release energy and more neutrons. How often that happens depends on neutron concentration. Without that provoking push, the uranium nuclei would just split when they felt like it and that’s the natural halflife.”

“Wait. I know that curve, it’s an exponential. Why isn’t e in the equation?”

“It could be. Would you prefer e-0.69315*t/half‑life? Works just as well but it’s clumsier. Base‑2 makes more sense when you’re talking halves. Usually when you say ‘exponential’ people visualize an increase. Here we’re looking at a decrease by a constant percentage rate but yeah, that’s an exponential, too. You get a falling curve like that from a Geiger counter and you’re watching counts per minute from someone’s thyroid that’s been treated with iodine‑131. Its 8‑day half‑life is slow enough to track that way. Really short half‑lives I don’t know much about; I care about the slow disintegraters that are either primordial or generated by some process.”

“Primordial — that means ‘back to the beginning’, which in your specialty would mean the beginning of the Solar System. We’re pretty sure the Sun’s pre‑planetary disk was built from dust broadcast by stars that went nova. Isotopes in the dust must be the primordial isotopes, right? Which ones are the other kind?”

“Mmm, aluminum‑26 is a good example. The half‑life equation still applies even for million‑year intervals. Half‑life of aluminum‑26 is about 0.7 million years and it decays to magnesium‑26. Whatever amount got here from the stars would have burnt down to a trillionth of that within the first 30 million years or so after arrival. Any aluminum‑26 we find today couldn’t be primordial. On the other hand, cosmic rays can smack a proton and neutron out of a silicon‑28 nucleus and voila! a new aluminum‑26. There’s a steady rain of cosmic rays out in space so there’s a steady production of aluminum‑26 out there. Not here on Earth, though, because our atmosphere blocks out most of the rays. Very nice for us geologists who can compare measured aluminum‑26 to excess magnesium‑26 to determine when a meteorite fell.”

“Excess?”

“Background magnesium is about 10% magnesium‑26 so we have subtract that to get the increment which came from aluminum‑26. A lot of the arguments in our field hinge on how much of which isotope is background or was background when a given rock formed. That’s one reason you see so much press about tiny but rugged zircons. They’re key to uranium‑lead dating. Crystallizing zirconium silicate doesn’t allow lead ions into its structure but it happily incorporates uranium ions. Uranium‑235 and uranium‑238 both decay to crystal‑trapped lead, but each isotope goes to a different lead isotope and with a different half‑life. The arithmetic’s simpler and the results are more definitive when you know that the initial lead content was zero.”

“So that aluminum‑magnesium trick’s not your only tool?”

“Hardly. The nuclear chemists have given us a long list of isotope chains, what decays to what with what half‑life and how much energy the radiating particle gets. Nuclei flit between quantum energy levels just like atoms and molecules do, except a spectrum of alpha or beta particles is a different game from the light‑wave spectrum. Tell me a radiated particle’s energy and I can probably tell you which isotope spat it out and disappeared.”

“Your ladder rungs are Cheshire Cat grins.”

~~ Rich Olcott

The Not-so-dangerous Banana

“Y’know, Cathleen, both our ladders boil down to time. Your Astronomy ladder connects objects at different times in the history of the Universe. My Geology ladder looks back into the Solar System’s history.”

“As an astronomer I normally think of parsecs or lightyear distances but you have a point, Kareem. Edwin Hubble linked astronomical space with time. Come to think of it, my cosmologist colleagues work almost exclusively in the time domain, like ‘T=0 plus a few lumptiseconds.’ Billions of years down to that teeny time interval — how does your time ladder compare?”

“Lumptiseconds out to a hundred trillion times the age of the Universe. I win.”

“C’mon, Kareem.”

“No, really, Sy. My ladder uses isotopes. Every carbon atom has 6 protons in the nucleus, right? Carbon‑12 adds 6 neutrons and it’s stable but another isotope, carbon‑14, has 8 neutrons. It’s radioactive — spits out an electron and becomes stable nitrogen‑14 with 7 and 7. Really heavy isotopes like uranium‑238 spit out alpha particles.”

“Wait, if carbon‑14 spits out an electron doesn’t that make it a carbon ion?”

“Uh‑uh, Cathleen, the electron comes out of the nucleus, not the electron cloud. It’s got a hundred thousand times more energy than a chemical kick could give it. Sy could explain—”

“Nice try, Kareem, this is your geologic time story. Let’s stay with that.”

“If I must. So, the stable isotopes last forever, pretty much, but the radioactive ones are ticking bombs with random detonation times.”

“What’s doing the ticking? Surely there’s no springs or pendulums in there.”

“Quantum, Cathleen. Sy’s trying to stay out of this so I’ll give you my outsider answer. I picture every kind of subatomic particle constantly trying to leave every nucleus, butting their little heads bazillions of times a second against walls set up by the weak and strong nuclear forces. Nearly every try is a bounce‑back, but one success is enough to break the nucleus. Every isotope has its own personal set of parameters for each kind of particle — wall height, wall thickness, something like an internal temperature ruling how hard the particles hit the walls. The ticking is those head‑butts; the randomness comes from quantum’s goofy rules somehow. How’s that, Sy?”

“Good enough for jazz, Kareem. Carry on.”

“Right. So every kind of radioisotope is characterized by what kinds of particle it emits, how much energy each kind has after busting through a wall, and how often that happens in a given sample size. And the isotope’s chemistry, of course, which is the same as every other isotope that has the same number of protons. The general rule is that the stable isotopes have maybe a few more neutrons than protons but nearly every element has some unstable isotopes. The ones with too many neutrons, like carbon‑14, emit electrons as beta particles. They go up a square in the Periodic Table. Too few and they drop down by emitting a positron.”

“All those radioactive stand‑ins for normal atoms. Sounds ghastly. Why are we still here and not all burnt up?”

“First, when one of these atoms decays by itself it’s a lot of energy for that one atom, but the energy spreads out as heat across many atoms. Unless a bunch of atoms crumble at about the same time, there’s only a tiny bit of general heating. The major biological danger from radioactivity comes from spit‑out particles breaking protein or DNA molecules.”

“Mutated, not burnt.”

“Mm‑hm. Second, the radioactives are generally rare relative to their stable siblings. In many cases that’s because the bad guys, like aluminum‑26, have had time to decay to near‑zero. That banana you’re eating has about half a gram of potassium atoms but only 0.012% are unstable potassium‑40. Third, an isotope with a long half‑life doesn’t lose many atoms per unit time. A kilogram of tellurium‑128, for instance, loses 2000 atoms per year. The potassium‑40 in your banana has a half‑life of nearly 2 million years. Overall, it releases only about 1300 beta particles per second producing less than a nanowatt of heat‑you‑up power. Not to worry.”

“Two million years? How do you measure something that slow?”

~~ Rich Olcott

EROs Atop A Ladder

“‘That’s where the argument started? That’s right up there with ‘Then the murders began.’ Cathleen Cliff‑hanger strikes again.”

<giggling> “Gotcha, Sy, just like always. Sorry, Kareem, we’ve had this thing since we were kids.”

“Don’t mind me, but do tell him what’s awry with the top of your galactic distance ladder.”

“I need to fill you in first about the ladder’s framework. We know the distances to special ‘standard candles’ scattered across the Universe, but there’s oodles of other objects that aren’t special that way. We can’t know their distances unless we can tie them to the candles somehow. Distance was Edwin Hubble’s big thing. Twenty years after Henrietta Swan Leavitt identified one kind of candle, Hubble studied the light from them. The farthest spectra were stretched more than the closest ones. Better yet, there was a strict relationship between the amount of stretch, we call it the z factor, and the candle’s distance. Turns out that everything at the intergalactic scale is getting farther from everything else. He didn’t call that expansion the Hubble Flow but we do. It comes to about 7% per billion lightyears distance. z connects candle spectrum, object spectrum and object distance. That lets us calibrate successive overlapping steps on the distance ladder, one candle type to the next one.”

“A constant growth rate — that’s exponential, by definition. Like compound interest. The higher it gets, it gets even higher faster.”

“Right, Kareem, except that in the past quarter-century we’ve realized that Hubble was an optimist. The latest data suggests the expansion he discovered is accelerating. We don’t know why but dark energy might have something to do with it. But that’s another story.”

“Cathleen, you said the distance ladder’s top rung had something to do with surface brightness. Surface of what?”

“Galaxies. Stars come at all levels of brightness. You can confirm that visually, at least if you’re in a good dark‑sky area. But a galaxy has billions of stars. When we assess brightness for a galaxy as a whole, the brightest stars make up for the dimmest ones. On the average it’ll look like a bunch of average stars. The idea is that the apparent brightness of some galaxy tells you roughly how many average stars it holds. In turn, that gives you a rough estimate of the galaxy’s mass — our final step up the mass ladder. Well, except for gravitational lensing, but that’s another story.”

“So what’s wrong with that candle?”

“We didn’t think anything was wrong until recently. Do you remember that spate of popular science news stories a year ago about giant galaxies near the beginning of time when they had no business to exist yet?”

“Yeah, there was a lot of noise about we’ll have to revise our theories about how the Universe evolved from the Big Bang, but the articles I saw didn’t have much detail. From what you’ve said so far, let me guess. These were new galaxy sightings, so probably from James Webb Space Telescope data. JWST is good at infra‑red so they must have been looking at severely stretched starlight—”

z-factor near 8″

“— so near 13 billion lightyears old, but the ‘surface brightness’ standard candle led the researchers to claim their galaxies held some ridiculous number of stars for that era, at least according to current theory. How’d I do?”

“Good guess, Sy. That’s where things stood for almost a year until scientists did what scientists do. A different research group looking at even more data as part of a larger project came up with a simpler explanation. Using additional data from JWST and several other sources, the group concentrated on the most massive galaxies, starting with low‑z recent ones and working back to z=9. Along the way they found some EROs — Extremely Red Objects where a blast of infra‑red boosts their normal starlight brightness. The researchers attribute the blast to hot dust associated with a super‑massive black hole at each ERO’s center. The blast makes an ERO appear more massive than it really is. Guess what? The first report’s ‘ridiculously massive’ early galaxies were EROs. Can’t have them in that top rung.”

“Kareem, how about the rungs on your ladder?”

~~ Rich Olcott

One Step After Another

Mid-afternoon, time for a coffee break. As I enter Cal’s shop, I see Cathleen and Kareem chuckling together behind a jumble of Cal’s distinctive graph‑lined paper napkins. “What’s the topic of conversation, guys?”

“Hi, Sy. Kareem and I are comparing ladders.”

I look around, don’t see anything that looks like construction equipment.

“Not that kind, Sy. What’s your definition of a ladder?”

“Getting down to definitions, eh, Kareem? Okay, it’s a framework with steps you can climb up towards something you can’t reach.”

“Well, there you go.”

“Not much help, Cathleen. What are you really bantering about?”

“Each of our fields of study has a framework with steps that let us measure something that’d be way out of reach without it.”

“You’ll appreciate this, Sy — our ladders even use different math. The steps on Cathleen’s ladder are mostly linear, mine are mostly exponential.”

“And they’re both finicky — you have to be really careful when using them.”

“And they’ve both recently had adjustments at the top end.”

“I can see the fun, I think. How about some specifics?”

They exchange a look, Kareem gestures ‘after you‘ and Cathleen opens. “Mine’s in astrometry, Sy, the precise recording of relative positions. Tycho Brahe’s numbers were good to a few dozen arcseconds—”

“Arcsecond?”

1/60 of an arcminute which is 1/60 of a degree which is 1/360 of a full circle around the sky. Good enough in Newton’s day for him to explain planetary orbits, but we’ve come <ahem> a long way since then. The Gaia telescope mission can resolve certain objects down to a few microarcseconds but that’s only half the problem.”

“Let me guess — you have angles but you don’t have distances.”

“Bingo. Distance is astrometry’s biggest challenge.”

“Wait, Newton’s Law of Gravity includes r as the distance between objects. For that matter, Kepler’s Laws use and . Couldn’t you juggle them around to evaluate r?”

“Nope. Kepler did ratios, not absolute values. Newton’s Law has but you can rewrite it as F ² = GMm/r² = G(M/r)(m/r), G times the product of two mass‑to‑distance ratios. Newton’s G is our least‑accurate physical constant and we don’t have good handles on either of those numerators. Before space flight we just had mass ratios like M/m. We only discovered the Moon’s absolute mass when we orbited it with spacecraft of known mass. That’s the lowest rung on our mass ladder. Inside the Solar System we go step by step with orbit ratios. Outside the system everything’s measured relative to Solar mass.”

“I’m getting the ladder idea. So how do you distances?”

“Lowest rung is parallax, like binocular vision. You look at something from two different points a known distance apart. Measure the angle between the sight‑lines. Figure the triangles to get the something’s distance. The earliest example I know of was in the mid‑1700s when astrometers thousands of miles apart on Earth watched Venus cross the Sun’s disk. Each recorded the precise time they saw Venus touch the Sun’s disk. Given the time shift and the on‑Earth distance, some trigonometry gave them the Earth‑Venus distance. That put a scale to Newtonian orbital diagrams. Parallax across the width of Earth’s orbit yielded stellar distances out to thousands of lightyears with Hubble. We expect ten times better from Gaia.”

“That gets you maybe across the Milky Way. What about farther out?”

“Several ingenious variations on the parallax idea, but mostly standard candles.”

“Candles?”

“Suppose you measure the brightness of a candle that’s a known distance away and there’s an equally luminous candle some unknown distance away. Measured brightness falls as the square of the distance, so if the second candle appears half as bright it’s four times the distance and so on. Climbing the cosmic distance ladder is going from one kind of uniformly‑luminous candle to another kind farther away.”

“Such as?”

“We know how brightness relates to bright‑dim‑bright cycle time for several types of variable stars. That gets us out to 30 million lightyears or so. Type I‑a supernovas act as useful candles out to a billion lightyears. Beyond that we can use galaxy surface brightness. That’s where the recent argument started.”

~ Rich Olcott

  • Thanks to Ken Burke for mentioning tellurium‑128’s septillion‑year half‑life.

A Big Purple Snowball

Cathleen’s back at the mic. “Okay, folks, now for the third speaker in tonight’s Crazy Theory seminar. Kareem, you have the floor.”

“Thanks, Cathleen. Some of you already know I do old‑rock geology. If a rock has a bone in it, I’m not interested. Paleontology to me is like reading this morning’s newspaper. So let me take you back to Precambrian times when Earth may have been purple.”

Kareem’s a quiet guy but he’s got the story‑teller’s gift, probably honed it at field expedition campfires, so we all settle back to listen.

“Four and a half billion years ago, Earth was bright orange. That’s not the color it reflected, that’s the color it glowed. You’ve all seen glass‑blowers at work, how the material gives off a bright orange light coming out of the flame or furnace, soft and ready to be formed. That’s what the planet’s surface was like after its Moon‑birthing collision with Theia. Collisions like that release so much heat that there’s no rocks, just layers of smooth molten glassy slag floating on fluid silicates and nickel‑iron like in a blast furnace. No atmosphere, all the volatiles have been boiled off into space. Got the picture?”

General nodding, especially from maybe‑an‑Art‑major who’s good at pictures.

“Time passes. Heat radiating away cools the world from the outside inward. Now the surface is a thin glassy cap, black like obsidian and basalt, mostly smooth. The cooling contracting cap fractures from the tension while the shrinking interior pulls inward, slow but not gentle. The black glassy surface becomes low craggy mountains and razor‑rubble, sharp enough to slice hiking boots to ribbons. There’s no erosive wind or water yet to round things off. Everything stays sharp‑edged.”

Voice from the back of the room — “Where’s our water from then?”

“Good question. Could be buried water that never got the chance to escape past the cap, could be water ferried in on icy comets or worldlets. People argue about it and I’m not taking sides. The planet gets a new color after it cools enough to hold onto water molecules however they got there — but that water doesn’t stay on the surface. Raindrops hitting still‑hot rock hiss back into steamy clouds. If you were on the moon at the time you’d see a white‑and‑grey Earth like Jupiter’s curdled cloud-tops. Visualize a series of million‑year Hurricane Debbies, all over the world.”

He pauses to let that sink in.

“When things finally cool down enough to allow surface water there’s oceans, but they’re not blue. Millions of years of wind and water erosion have ground the sharp rubble to spiky dust. Most of the thrust‑raised mountains, too. Much of the dust is suspended or dissolved in the ocean turning it black. For a while. The dust is loaded with minerals, especially sulfides, very nutritious for a group of not‑quite bacteria called Archaea that eat sulfides using a molecule that’s powered by green light but reflects red and blue. When the Archaea take over, the oceans look magenta from the reflected red and blue.”

Maybe‑an‑Art‑major giggles.

“Next major event, we think, was the Huronian Glaciation, when most or all of the Earth was a solid white because it was covered with ice. Killed off most or the Archaea. When that melted, different parts of the ocean turned black from floating dead Archaea and and then milky turquoise from sulfur particles. Next stage was purple, from a different group of sulfur‑eating purple almost‑bacteria. Then we had snowball whiteness again, which gave green‑reflecting chlorophyll‑users a chance to take over, clear our the sulfur and leave the oceans blue.”

VBOR — “That’s your Crazy Theory?”

“No, that’s mostly mainstream. Question is, what terminated the deepfreezes? Lots of ideas out there — solar dimming and brightening, different combinations of CO2 and methane from volcanoes or bacteria, even meteorites. Anyone remember Ian Malcom’s repeated line in the Jurassic Park movies?”

Everyone — “Life will find a way!”

“Right on. My crazy’s about the two almost‑bacteria. Suppose each kind managed to infiltrate their day’s Great Extinction glaciers. Suppose planet‑wide bacterial purple pigments absorbed sunlight’s energy, melting the ice. Karma, yes?”

~ Rich Olcott

To Fly on Another World

“Uncle Sy, why is PV=nRT the Ideal Gas Equation? Is it because it’s so simple but makes sense anyway?”

“It is ideal that way, Teena, but it’s simply an equation about gases that are ideal. Except there aren’t any. Real gases come close but don’t always follow the rule.”

“Why not? Are they sneaky?”

“Your kind of question. We like to think of gas particles as tiny ping‑pong balls that just bounce off of each other like … ping‑pong balls. That’s mostly true most of the time for most kinds of gas. One exception has to do with stickiness. Water’s one of the worst cases because its H2O molecules like to chain up. When two H2Os collide, if they’re pointed in the right directions they share a hydrogen atom like a bridge and stick together. If that sort of stickiness happens a lot then the quantity measure n acts like it’s less than we’d expect. That makes the PV product smaller.”

“I bet that doesn’t happen much when the gas is really hot. Two particles might stick and then BANG! another particle hits ’em and breaks it up!”

“Good thinking and that’s true. But there’s another kind of exception that holds even at high temperatures. A well‑behaved gas is mostly empty space because the ping‑pong balls are far apart unless they’re actually colliding. But suppose you squeeze out nearly all of the empty space and then try to squeeze some more.”

“Oh! The pressure gets even bigger than the equation says it should because you can’t squeeze the particles any smaller than they are, right?”

“Exactly.”

“Well, if the equation has these problems, why do we even use it at all?”

“Because it’s good enough, enough of the time, and we know when not to use it. I’ll give you an example. One of my clients wanted to know air density at ground level on Saturn’s moon Titan and all the planets that have an atmosphere.” <showing Old Reliable’s screen> “I found the planet data I needed in NASA’s Planetary Science website, but I had to do my own calculation for Titan. The pressure’s not crazy high and the temperature’s chilly but not quite cold enough to liquify nitrogen so the situation’s in‑range for the Ideal Gas Equation.”

“What’s a Pa?”

“That’s the symbol for a pascal, the unit of pressure. kPa is kilopascals, just like kg is kilograms. Earth’s atmospheric pressure is about 100 kPa.”

“Reliable says Wikipedia says Titan’s air is mostly nitrogen like Earth’s air is. Titan’s just a moon so it has to be smaller than Earth so its gravity must be smaller, too. Why is its atmosphere so much denser?”

“The cold. Titan’s air is 200 kelvins colder than Earth’s average temperature. You’re right, an individual gas particle feels a smaller pull of gravity on Titan, but it doesn’t have much kinetic energy to push its neighbors away so they all crowd closer together.”

“Why in the world does your client want to know that density number?”

“Clients rarely give me reasons. I suspect this has to do with designing a Titan‑explorer aircraft.”

“Ooo! Wait, what does that have to do with air density?”

“It has to do with how hard the machine has to work to push itself up. It’ll probably have horizontally spinning blades that push the air downwards, like helicopters do. With a setup like that, the lift depends on the blade’s length, how fast it’s spinning, and how dense the air is. If the air is dense, like on Titan, the designers can get the lifting thrust they need with short blades or a slow spin. On Mars the density’s only 2% of Earth’s so Ingenuity‘s rotors were 4 feet across and spun about ten times faster than they’d have to on Earth.”

“What about on our helium‑oxygen Earth?”

“That’s pretty much the same calculation. Give me a sec.” <tapping on Old Reliable’s screen> “Gas density would be a tenth of Earth’s, but a HeO‑copter would have to work against full‑Earth gravity. Huge blades rotating at supersonic speeds. Probably not a practical possibility.”

“Aw.”

“Yeah.”

~ Rich Olcott

The Ideal Gas Game

“But Uncle Sy, you never did answer my real question!”

“What question was that, Teena?”

“About the helium planet. With oxygen. Oh, I guess I never did get around to asking that part of it. You side‑tracked us into how a helium‑oxygen atmosphere would be unstable unless it was really cold or the planet had more gravity than Earth so the helium wouldn’t fly away. But what I wanted to know was, what would it be like before the helium left? Like, could we fly a plane there?”

“Mmm, let’s get a leetle more specific. You asked about swapping all of Earth’s atmospheric nitrogen with helium. Was that one helium atom for each nitrogen molecule or each nitrogen atom?”

“What difference would that make?”

“Mass, to begin with. A helium atom weighs about 1/3 of a nitrogen atom, 1/7 of a nitrogen molecule. The atmospheric pressure we feel is the weight of all the air molecules above us. Swap out 80% of those molecules for something lighter, pressure goes down whether we swap helium for molecules or helium for atoms. We could calculate either one. But the change would be much harder to calculate for the atom‑for‑atom swap.”

“Why?”

“Mmm, have you gotten into equations yet in school?”

“You mean algebra, like 3x+7=8x+2? Yeah, they’re super‑easy.”

“This won’t even be as complicated as that. Here’s a famous Physics equation called The Ideal Gas Law — PV=nRT. Each letter stands for one quantity. Two adjacent quantities are multiplied together, okay? The pressure in a container is P, the container’s volume is V, T is the absolute temperature, and n is a measure of how much gas is in there.”

“You skipped R.”

“Yes, I did. It’s a constant number. Its job is to make all the units come out right. For instance, if the pressure’s in atmospheres, the volume’s in liters, n is in grams of helium and the temperature is in kelvins, then R is 0.021. Suppose you’re holding a balloon filled with helium and it’s at room temperature. What can you say about the gas?”

“Umm, all the nRT stuff doesn’t change so P times V, whatever it is, doesn’t change either.”

“If we let it fly upward until the pressure was only half what it is here…?”

“Then V would double. The balloon would get twice as big. Unless it burst, right?”

“You got the idea. Okay, now let’s fiddle with the right-hand side. Suppose we double the amount of helium.”

P times V must get bigger but we don’t know which one.”

“Why not both?”

“Wooo… Each one could get some bigger… Oh, wait, I’m holding the balloon so the pressure’s not going to change so the balloon gets twice bigger.”

“Good thinking. One more thing and we can get back to your difference question. The Ideal Gas Law doesn’t care what kind of gas you’re working with. All the n quantity really cares about is how many particles are in the gas. A particle can be anything that moves about independently of anything else — helium atom or nitrogen molecule, doesn’t matter. If you change the definition of what n is measuring, all that happens is you have to adjust R so the units come out right. Then the equation works fine. Next step—”

“Wait, Uncle Sy, I want to think this atom‑or‑molecule thing through for myself. I’m gonna ignore R times T because both of them stay the same. So if we swap one atom of helium for one molecule of nitrogen, the number of particles doesn’t change and PV doesn’t change. But if we swap one atom of helium for each atom of nitrogen then n doubles and so does PV. But if we do that for the whole atmosphere then we can’t say that the pressure won’t change because the atmosphere could just expand and that’s the V but the pressures are all different as you go higher up anyway. Oh, wait, T changes, too, because it’s cold up there. It’s complicated, isn’t it?”

“It certainly is. Can we stick to just the simple atom‑for‑molecule swap?”

“Uh‑huh.”

~~ Rich Olcott

  • Thanks again, Xander, and happy birthday. Your question was deeper than I thought.

A Virial Homework Problem

“Uh, Mr Moire? Would you mind if we used Old Reliable to do the calculations on this problem about the galaxy cluster’s Virial?”

Data extracted and re-scaled from Fig 2 of Smith (1936), The Mass of the Virgo Cluster

“Mm, only if you direct the computation, Jeremy. I want to be able to face Professor Hanneken with a clear conscience if your name ever comes up in the conversation. Where do we start?”

“With the data he printed here on the other side of the problem sheet. Old Reliable can scan it in, right?”

“Certainly. What are the columns?”

“The first one’s clear. The second column is the distance between the galaxy and the center of the cluster. Professor Hanneken said the published data was in degrees but he converted that to kiloparsecs to get past a complication of some sort. The third column is, umm, ‘the relative line‑of‑sight velocity.’ I understand the line‑of‑sight part, but the numbers don’t look relativistic.”

“You’re right, they’re much smaller than lightspeed’s 300,000 km/s. I’m sure the author was referring to each galaxy’s motion relative to the other ones. That’s what the Virial’s about, after all. I’ll bet John also subtracted the cluster’s average velocity from each of the measured values because we don’t care about how the galaxies move relative to us. Okay, we’ve scanned your data. What do we do next?”

“Chart it, please, in a scatter plot. That’s always the first thing I do.”

“Wise choice. Here you go. What do we learn from this?”

“On the whole it looks pretty flat. Both fast and slow speeds are spread across the whole cluster. If the whole cluster’s rotating we’d see faster galaxies near the center but we don’t. They’re all moving randomly so the Virial idea should apply, right?”

“Mm-hm. Does it bother you that we’re only looking at motion towards or away from us?”

“Uhh, I hadn’t thought about that. You’re right, galaxy movements across the sky would be way too slow for us to detect. I guess the slowest ones here could actually be moving as fast as the others but they’re going crosswise. How do we correct for that?”

“Won’t need much adjustment. The measured numbers probably skew low but the average should be correct within a factor of 2. What’s next?”

“Let’s do the kinetic energy piece T. That’d be the average of galaxy mass m times v²/2 for each galaxy. But we don’t know the masses. For that matter, the potential energy piece, V=G·M·m/R, also needs galaxy mass.”

“If you divide each piece by m you get specific energy, joules/kilogram of galaxy. That’s the same as (km/s)². Does that help?”

“Cool. So have Old Reliable calculate /2 for each galaxy, then take the average.”

“We get 208,448 J/kg, which is too many significant figures but never mind. Now what?”

“Twice T would be 416,896 which the Virial Theorem says equals the specific potential energy. That’d be Newton’s G times the cluster mass M divided by the average distance R. Wait, we don’t know M but we do know everything else so we can find M. And dividing that by the galaxy count would be average mass per galaxy. So take the average of all the R distances, times the 416,896 number, and divide that by G.”

“What units do you want G in?”

“Mmm… To cancel the units right we need J/kg times parsecs over … can we do solar masses? That’d be easier to think about than kilograms.”

“Old Reliable says G = 4.3×10⁻³ (J/kg)·pc/Mʘ. Also, the average R is … 890,751 parsecs. Calculating M=v²·R/G … says M is about 90 trillion solar masses. With 29 galaxies the average is around 3 trillion solar masses give or take a couple of factors of 2 or so.”

“But that’s a crazy number, Mr Moire. The Milky Way only has 100 billion stars.”

“Sometimes when the numbers are crazy, we’ve done something wrong. Sometimes the numbers tell us something. These numbers mutter ‘dark matter‘ but in the 1930s only Fritz Zwicky was listening.”

~~ Rich Olcott

  • Thanks again to Dr KaChun Yu for pointing out Sinclair Smith’s 1936 paper. Naturally, any errors in this post are my own.