<chirp, chirp> “Moire here.”
“Hi, Sy, it’s Vinnie. Eddie just dropped off my pizza order —”
“What did you get?”
“My usual, large with extra pepperoni. Anyhow, Eddie said you guys were talking about Money Physics which has me curious. I don’t suppose it’s about how young George Washington couldn’t have thrown that silver dollar across the Potomac.”
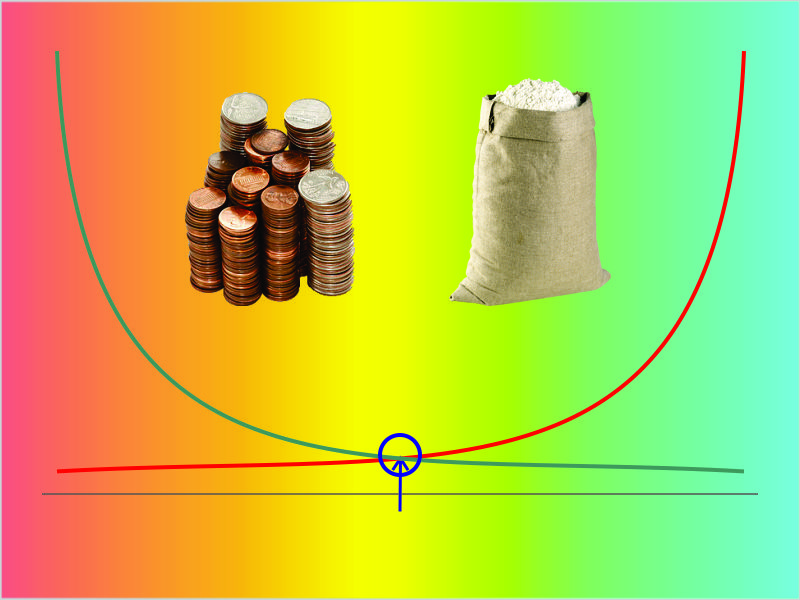
“It couldn’t have been a US dollar because they didn’t exist yet and it couldn’t have been the Potomac because it’s a mile wide and probably nothing of the sort happened anyway. You’re right, though. What I’m calling Money Physics is about the parallels and differences between Economics and Newtonian Physics. Remember that $20 bill your dice‑playing won from Eddie a while ago and he signed it?”
“Yeah, that was fun. I was hot that night.”
“Well, the other day I used that very same bill to pay Eddie for pizza.”
“How’d you get it?”
“We figured you used the bill to pay down your tab at Al’s —”
“That’s right.”
“And he used it to buy some old astronomy magazines from me. I paid it to Eddie to complete the circle. ‘Whoa,’ I thought. ‘The velocity of money, like in Economics.”
“There’s a word I know from flight school. Velocity’s a vector, combines speed and direction. Speed would be how quick money changes hands, of course, but how do you attach a direction to that and what do you figure from the vectors?”
“Their equivalent to speed isn’t what you think it is and there’s no notion of direction. The ghost that’s left is the concept that ‘velocity of money‘ should describe how often a unit of currency is reused. The problems start popping up when you try to measure that. Economists grew up thinking about first‑purchase productivity so their metrics exclude a lot of what we’d consider economic activity. That traveling $20, for instance. How many transactions would you say it went through?”
“Eddie to me to Al to you to Eddie. Four.”
“Sorry, the productivity right answer is one. Eddie didn’t buy anything from you when he lost those bets. Your debt to Al was already outstanding. Al bought used goods from me. The only transaction that counts in the productivity calculation was my paying for what came fresh from Eddie’s pizza oven.”
“Dice games don’t count? How about bank fees or talking to my lawyer, stuff like that?”
“Oh, there’s lots of controversial questions, especially in view of our economy turning from mostly farm and manufacturing to mostly services and now we’re paying attention to environmental costs. ‘Reuse, repurpose, recycle‘ doesn’t enter into the productivity equation, and neither does installing a pollution control system except for the initial purchase price. Do you own stock, maybe in a pension plan?”
“Not as much as I’d like, especially recently.”
“I know the feeling. When you bought your shares, the brokerage fee counted as services but economists argue about the cost of the shares themselves. There are loads of what-abouts like that. Bottom line is that trying to track money movement at the transaction level just doesn’t work.”
“So what did they do?”
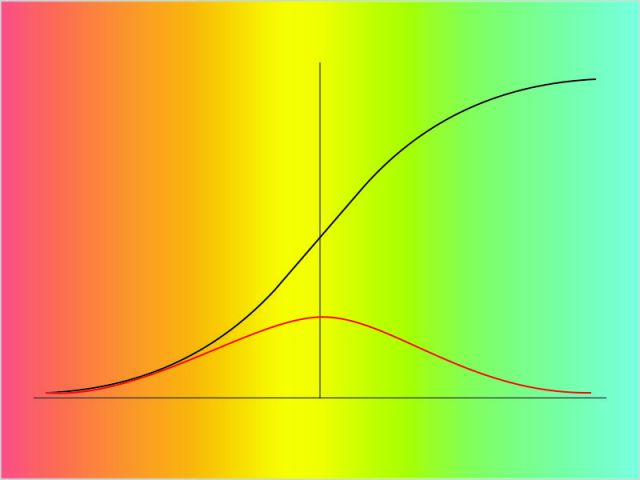
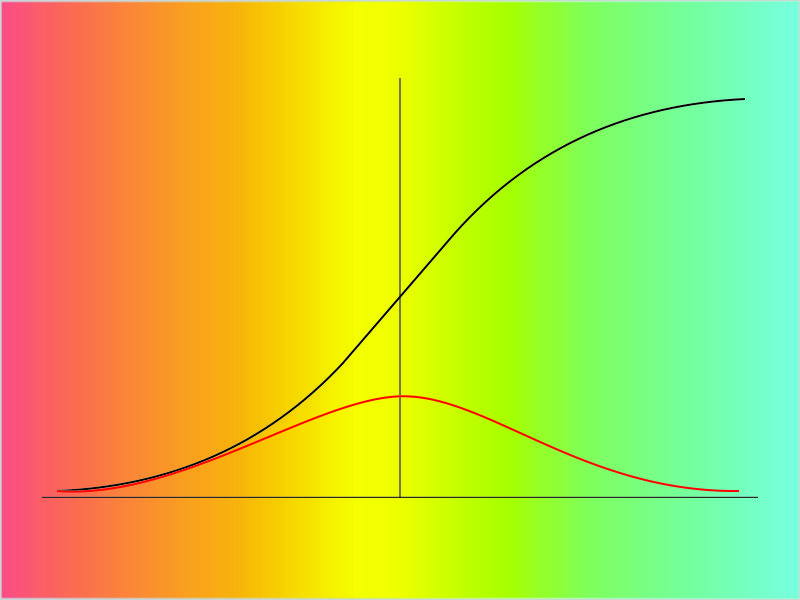
“Fell back to country-level aggregate numbers which are very rough by Physics standards. Add up the total economic traffic in dollars, divide by the size of the money supply, that’s the number of times an average dollar must have changed hands, OK?”
“Gimme a sec … that sounds right.”
“So how do you evaluate each part of the fraction? Some people measure economic activity indirectly by summing up transactions, maybe by looking at sales tax revenue data. That’s the spend side. Or you could look at the income side using payroll or income tax data and supposing that people spend everything they pull in. It’s not a hard think to find holes in both of those, but suppose you come up with a number somehow. That gets divided by the money supply, which we understand a little better but not much. Do the arithmetic and you have a dollars-to-dollars ratio, not somethings-per-time. No physicist would call that a velocity, but what can you do?”
“You got me, but who cares?”
“The Fed cares, because velocity‑based thinking helps drive their policy decisions.”
~~ Rich Olcott