A Star’s Tale

It’s getting nippy outside so Al’s moved his out‑front coffee cart into his shop. Jeremy’s manning the curbside take‑out window but I’m walking so I step inside. Limited seating, of course. “Morning, Al. Here’s my hiking mug, fill ‘er up with high‑test and I’ll take a couple of those scones — one orange, one blueberry. Good news that the Governor let you open up.”

“You know it, Sy. Me and my suppliers have been on the phone every day. Good thing we’ve got long‑term relationships and they’ve been willing to carry me but it gets on my conscience ’cause they’re in a crack, too, ya know?”

“Low velocity of money hurts everybody, Al. Those DC doofuses and their political kabuki … but don’t get me started. Hey, you’ve got a new poster over the cash register.”

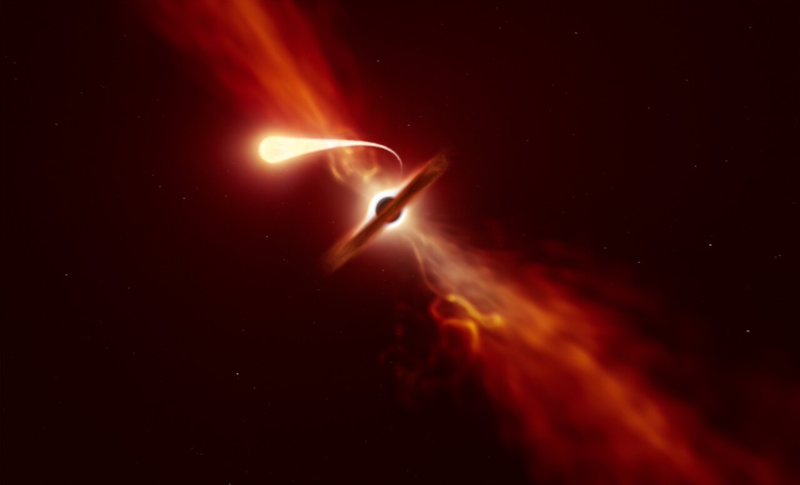
“You noticed. Yeah, it’s a beaut. Some artist’s idea of what it’d look like when a star gets spaghettified and eaten by a black hole. See, it’s got jets and a dust dusk and everything.”

“Very nice, except for a few small problems. That’s not spaghettification, the scale is all wrong and that tail-looking thing … no.”

Artist’s impression of AT2019qiz. Credit: ESO/M. Kornmesser
Under Creative Commons Attribution 4.0 International License

“Not spaghettification? That’s what was in the headline.”

“Sloppy word choice. True spaghettification acts on solid objects. Gravity’s force increases rapidly as you approach the gravitational center. Suppose you’re in a kilometer-long star cruiser that’s pointing toward a black hole from three kilometers away. The cruiser’s tail is four kilometers out. Newton’s Law of Gravity says the black hole pulls almost twice as hard on the nose as on the tail. If the overall field is strong enough it’d stretch the cruiser like taffy. Larry Niven wrote about the effect in his short story, Neutron Star.”

“The black hole’s stretching the star, right?”

“Nup, because a star isn’t solid. It’s fluid, basically a gas held together by its own gravity. You can’t pull on a piece of gas to stretch the whole mass. Your news story should have said ‘tidal disruption event‘ but I guess that wouldn’t have fit the headline space. Anyhow, an atom in the star’s atmosphere is subject to three forces — thermal expansion away from any gravitational center, gravitational attraction toward its home star and gravitational attraction toward the black hole. The star breaks up atom by atom when the two bodies get close enough that the black hole’s attraction matches the star’s surface gravity. That’s where the scale problem comes in.”

Al looks around — no waiting customers so he strings me along. “How?”

“The supermassive black hole in the picture, AT2019qiz, masses about a million Suns‑worth. The Sun‑size star can barely hold onto a gas atom at one star‑radius from the star’s center. The black hole can grab that atom from a thousand star‑radii away, about where Saturn is in our Solar System. The artist apparently imagined himself to be past the star and about where Earth is to the Sun, 100 star‑radii further out. Perspective will make the black hole pretty small.”

“But that’s a HUGE black hole!”

“True, mass‑wise, not so much diameter‑wise. Our Sun’s about 864,000 miles wide. If it were to just collapse to a black hole, which it couldn’t, its Event Horizon would be about 4 miles wide. The Event Horizon of a black hole a million times as massive as the Sun would be less than 5 times as wide as the Sun. Throw in the perspective factor and that black circle should be less than half as wide as the star’s circle.”

“What about the comet‑tail?”

“The picture makes you think of a comet escaping outward but really the star’s material is headed inward and it wouldn’t be that pretty. The disruption process is chaotic and exponential. The star’s gravity weakens as it loses mass but the loss is lop‑sided. Down at the star’s core where the nuclear reactions happen the steady burn becomes an irregular pulse. The tail should flare out near the star. The rest should be jagged and lumpy.”

“And when enough gets ripped away…”

“BLOOEY!”

~~ Rich Olcott

  • Thanks to T K Anderson for suggesting this topic.
  • Link to Technical PS — Where Do Those Numbers Come From?.

Traffic Control

Jeremy Yazzie @jeremyaz
hi @symoire, this is jeremy. ive been reading about the osiris‑rex mission to astrroid bennu and how they’re bringing back a sample – so complicated – fancy robot arm, n2 squirter, air‑cleaner thingy – y not just vacuum the dust or pick up a rock?


Sy Moire @symoire
@jeremyaz – quick answer is that Bennu and OSIRIS-REx are already surrounded by the vacuum of space. Sample collectors can’t suck any harder that that. I’ll email you a more complete answer later


Hi, Sy, can you believe this weather? Temps last week were twice today’s high.

Not to a physicist, Sis.
Those 90s and today’s 45 are just Fahrenheit
scale numbers.
Can’t do ratios between them, “twice” does not compute.
I don’t suppose it would help if we went centigrade and said last week’s highs were around 35 and today it’s 5?

No, that’s worse, today’s down by 85% from last week.

Centigrade’s another scale you can’t do ratio arithmetic in. Kelvins is the way to go.
Temp in K tracks the average molecular kinetic energy.
Starts at zero where nothing’s moving and rises in proportion.
Last week’s highs ran around 308 K, today is 278 K.
Today we’re only 10% cooler than last week.

Physicists! Grrrr. However you measure the weather, it still feels cold. No picnic this weekend ;^(


From: Sy Moire <sy@moirestudies.com>
To: Jeremy Yazzie <jeremyaz@college.edu>
Subj: OSIRIS-REx

Jeremy –

OK, now I’m back at the office I’ve got better tech for writing long answers.

First, the “grab a rock” idea has several issues

  • If you pick up a rock, you only have that rock, says nothing about any of its neighbors or the subsurface material it might have smacked into. Dust should be a much better representation of the whole asteroid.
  • The rock might not be willing to be picked up. When the scientists and engineers were planning the OSIRIS‑REx mission, they didn’t know Bennu’s texture — could be one solid rock or a bunch of middle‑size rocks firmly cemented together or a loose “rubble pile” of all‑size rocks and dust held together by gravity alone, or anything in between.
  • Have you ever played one of those arcade games where you try to pick up a toy with a suspended claw gadget and all you’ve got is a couple of control knobs and a button? Picking up a specific rock, even a willing one, is hard when you’re a robot operating 15 light‑minutes away from the home office.

So dust it is, but how to plan dust collection in low gravity when you know nothing about the texture? Something like a whisk broom and dust pan would work unless the surface is too uneven. Something like a drill or disk sander would be good, except to use either one you need a solid footing to work from or else you go spinning one way when the tool spins the other. (That was a problem on the International Space Station.) The Hayabusa2 mission to asteroid Ryugu used a high‑velocity impactor to create dust, but a bad ricochet or shrapnel could kill the OSIRIS‑REx mission. The planners decided that best alternative was puff‑and‑grab.

So why not an astronautical Roomba that just sucks in the dust? The thing about vacuum is that it’s a place where gas molecules aren’t. Suppose you’re a gas molecule. You’re surrounded by your buddies, all in motion and bouncing off of each other like on a crowded 3‑D dance floor. You stay more‑or‑less in place because you’re being hit more‑or‑less equally from every direction. Suddenly there’s a vacuum to one side. You’re not hit as much over there so that’s the direction you and a bunch of your buddies move. If you encounter a dust particle, it picks up your momentum and moves toward the emptiness where it could be trapped in somebody’s filter.

The planners decided to capture dust particles by entraining them in a flow of gas molecules through a filter. To make gas flow you need more gas on one side then the other. Gas molecules being few and far between in space, the obvious place to put your pusher gas is inside the filter. Hence the nitrogen squirt technique and the “air‑cleaner thingy.”

— Sy

Diagram of TAGSAM in operation
Adapted from asteroidmission.org/?attachment_id=1699
Credit: University of Arizona

~~ Rich Olcott

Flattening The Curve

<chirp chirp> My phone’s non-business ring-tone. “Moire here.”

“Hi, Mr Moire, it’s me, Jeremy, again. Sorry for the hold-up. My phone’s on the charger now so we can keep going about the Logistics Curve and all.”

“Logistic Curve, Jeremy, singular. Logistics plural has to do with managing the details of a military or business operation. That’s quite different from population growth which is what the Logistic Curve is about. Though come to think of it, these days we’re seeing a tie‑in. So where were we?”

“We had that S-shaped Logistic Curve with exponential growth at the beginning but then it plateaus and you showed me a humpy curve that’s the slope of the other one and you said the humpy curve is like R = K*S*(N‑S) if N is everybody and S is how many are susceptible to the virus. But you kind of skipped over K.”

“True and I’ll get to K, but that ‘humpy’ curve is important. In the context of the pandemic, it’s people per day — how many catch the virus, how many show up for medical care, how many need ventilators or even mortuary care — there’s a different K for each question. The hump is what we’re trying to get control of. The K factors summarize a whole pipeline of ifs and maybes. Some of them are knobs that we may be able to use to flatten the hump.”

“We can do that? How?”

“Good question. Here, let me send your phone another image. Let me know when you receive it.”

“It’s here, Mr Moire. Looks like you’ve got three Logistic Curves but they’re stretched out different amounts.”

“Stretched out on the time axis, and that’s crucial. I generated those three plots by using different values for K. Sooner or later in all three models everyone catches the bug. In the blue-line case, though, that happens over a much longer time interval than in the red-line case. If you’re a public health official or hospital administrator you pray for the blue-line case — the slow initial rise gives you a heads-up and more time to get ready for future incoming cases. Better yet, because the cases-per-day peak is flatter you don’t need as many masks and ventilators to take of the patients and your front-line people are less likely to be over‑extended. Assuming you’ve hired enough in the first place.”

“So the government wants to reduce the K numbers to get to the blue-line case.”

“Absolutely. Keep in mind, K is such a complicated summary of things that realistic models are complex. Experienced modelers know that the more factors you put into a model, the riskier the predictions become. Anyway some of the things that go into K we can’t control, we can only measure or estimate them and try to account for what’d happen if something changes.”

“Like what?”

“Suppose you’re exposed to the virus. What’s the probability that you’ll come down with symptoms bad enough to need medical care? Current data suggests those odds depend a lot on uncontrollable things like your age and medical history. A model for a retirement community almost certainly needs a different set of K-values then a model for a college town full of teens and twenty-somethings. But that gets into a different cluster of factors.”

“That’s for sure. My grandparents are a lot more careful about their health than my crew is.”

“Which gets us into the K-factors we can at least try to manage. Simple example — you can’t catch the virus if you’re not exposed to it. That’s what Social Distancing is all about and that’s why you’re staying at home, thank you very much. Typically, models gauge that piece by surveying what fraction of the population is complying with the stay-at-home, masking and 6-feet-away rules. We need to get to 70% or better to keep the patients-per-day rate down to what the hospitals can cope with. A vaccine, when we get one, will have the same effect but that’s a year away.”

“Yeah, and if someone invents a good treatment so people don’t have to go on ventilators, that’d help the K for that end of the pipeline.”

“Get to work on it, Jeremy.”

~~ Rich Olcott

The Curve To Be Flattened

<chirp chirp> My phone’s ring-tone for an non-business call. “Moire here.”

“Mr Moire, it’s Jeremy.”

“I hope so, Jeremy, my phone shows your caller-ID. I’m glad you called instead of trying to drop by, the city being under lockdown orders and all. What’s your question?”

“Oh, no question, sir, I just called to chat. It’s lonely over here. If you’ve got the time, anything you’d like to talk about would be fine.”

“Mm… Well, I am working on a project but maybe talking it out will help get my thoughts in order. Have you seen that ‘Flatten the curve‘ chart?”

“Sure, it’s been hard to escape. They use it to tell us why we shouldn’t do group stuff while this virus is going around. Are you writing about where the chart comes from?”

“That’s my project, all right. There’re two ways to get to that chart and I’m trying to decide which will work better. I could start from ecology studies of invading organisms taking over a new territory. At first the organisms multiply rapidly, doubling then doubling again —”

“That’s exponential growth, Mr Moire. We talked about that!”

“Just sent you an image. When researchers plot invasions they usually look like the black line, the Logistic Curve. Its height represents the organism’s population as time increases left-to-right. At the beginning there’s that exponential rise. Over on the right the growth rate slows as the plants or animals or bugs use up increasingly scarce resources. The part in the middle’s almost linear. All that’s a familiar story by now, right?”

The Logistic Curve (black) and its slope (red)

“Uh-huh. We talked a lot about ecology back in kid school except we hadn’t learned graphs yet. What’s the red curve?”

“That’s the interesting part I’m trying to write about. One way to look at it is that it’s simply the slope of the Logistic curve. See how where the Logistic is rising, the slope is rising, too? That’s the way exponentials work — ‘the higher the faster‘ as they say. The slope switches direction just where the Logistic switches from growth to slow-down. The Logistic Curve approaches its limit when the organism’s population approaches the carrying capacity of the territory. That’s also where the slope gets shallowest. Very few resources, very little expansion.”

“What’s the other way to look at it?”

“We start with the slope curve itself. It has its own straight-forward interpretation, especially if the organism is a a bacterium or virus that causes disease. Consider the population under attack as the resource. How fast will the disease spread?”

“Uh… what I keep hearing is that if more people get sick, other people will get infected faster.”

“But what happens when nearly everyone’s caught it and they’ve either recovered or left us?”

“Oh, there’ll be fewer people left to catch it so the disease spreads more slowly.”

“Let me put that into algebra. I’ll write N for the total number of people and that’ll be a constant, we hope. At any given time we’ve got S as the current number of people who are susceptible. Then (N‑S) tells us how many people are NOT susceptible. Are you with me?”

“Fine so far.”

“So from what we’ve just said, the rate of infection is low when S is low and also low when (N‑S) is low. One way to make that into an equation is to write the rate as R = K*S*(N‑S). K is just a number we can adjust to account for things like virulence and Social Distance effectiveness. If we plot R against time what shape will it have?”

“Mmm… S is nearly the same as N at the start so (N‑S) is nearly zero then. At the finish, S is nearly zero. Exactly in the middle S equals (N‑S). They each have to be higher than near-zero there. That makes R be low at each end and high in the middle. Ah, that’s sort-of the shape of the slope curve!”

“It’s exactly the shape of the slope curve. So how do we flatten it?”

<click-click, click-click> “Oops, Mr Moire, my phone battery’s about dead. Gotta go get the charger. I’ll be right back.”

“I’ll be here, Jeremy.”

~~ Rich Olcott

Where would you put it all?

Vinnie’s a big guy but he’s good at fading into the background. I hadn’t even noticed him standing in the back corner of Cathleen’s impromptu seminar room until he spoke up. “That’s a great theory, Professor, but I wanna see numbers for it.”

“Which part of it don’t you like, Vinnie?”

“You made it seem so easy for all those little sea thingies to scrub the carbon dioxide out of Earth’s early atmosphere and just leave the nitrogen and oxygen behind. I mean, that’d be a lot of CO2. Where’d they put it all?”

“That’s a reasonable question, Vinnie. Lenore, could you put your Chemistry background to work on it for us?”

“Oh, this’ll be fun, but I don’t want to do it in my head. Mr Moire, could you fire up Old Reliable for the calculations?”

“No problem. OK, what do you want to calculate?”

“Here’s my plan. Rather than work with the number of tons of carbon in the whole atmosphere, I’ll just look at the sky-high column of air sitting on a square meter of Earth’s surface. We’ll figure out how many moles of CO2 would have been in that column back then and then work on how thick a layer of carbon stuff it would make on the surface. Does that sound like a good attack, Professor?”

“Sure, but I see a couple of puzzled looks in the class. You’d better say something about moles first.”

“Hey, I know about moles. Sy and me talked about ’em when he was on that SI kick. They’re like a super dozen, right, Sy?”

“Right, Vinnie. A mole of anything is 6.02×10²³ of that thing. Eggs, atoms, gas molecules, even stars if that’d be useful.”

“Back to my plan. First thing is the CO2 was in that column back when. Maria, your chart showed that Venus’ atmospheric pressure is 100 times ours and Mars’ is 1/100 ours and each of them is nearly pure CO2, right? So I’m going to assume that Earth’s atmosphere was what we have now plus a dose of CO2 that’s the geometric mean of Venus and Mars. OK, Professor?”

“That’d be a good starting point, Lenore.”

“Good. Now we need the mass of that CO2, which we can get from the weight of the column, which we can get from the air pressure, which is what?”

Every car buff in the room, in chorus — “14½ pounds per square inch.”

“I need that in kilograms per square meter.”

“Strictly speaking, pressure’s in newtons per square meter. There’s a difference between weight and force, but for this analysis we can ignore that. Keep going, Lenore.”

“Thanks, Professor. Sy?”

“Old Reliable says 10194 kg/m².”

“So we’ve got like ten-thousand kilograms of CO2 in that really tall meter-square column of ancient air. Now divide that by, um, 44 to get the number of moles of CO2. No, wait, then multiply by 1000 because we’ve got kilograms and it’s 44 grams per mole for CO2.”

“232 thousand moles. Still sounds like a lot.”

“I’m not done. Now we take that carbon and turn it into coal which is solid carbon mostly. One mole of carbon from each mole of CO2. Take the 232 thousand moles, multiply by 12 grams, no make that 0.012 kilogram per mole –“

“2786 kilograms”

“Right. Density of coal is about 2 grams per cc or … 2000 kilograms per cubic meter. So. Divide the kilograms by 2000 to get cubic meters.”

“1.39 meters stacked on that square-meter base.”

“About what I guessed it’d be. Vinnie, if Earth once had a carbon-heavy atmosphere log-halfway between Venus and Mars, and if the sea-plankton reduced all its CO2 down to coal, it’d make a layer all over the planet not quite as tall as I am. If it was chalk it’d be thicker because of the additional calcium and oxygen atoms. A petroleum layer would be thicker, too, with the hydrogens and all, but still.”

Jeremy’s nodding vigorously. “Yeah. We’ve dug up some of the coal and oil and put it back into the atmosphere, but there’s mountains of limestone all over the place.”

Cathleen’s gathering up her papers. “Add in the ocean-bottom carbonate ooze that plate tectonics has conveyor-belted down beneath the continents over the eons. Plenty of room, Vinnie, plenty of room.”

~~ Rich Olcott

The Moon And Chalk

Cathleen’s talking faster near the end of the class. “OK, we’ve seen how Venus, Earth and Mars all formed in the same region of the protosolar disk and have similar overall compositions. We’ve accounted for differences in their trace gasses. So how come Earth’s nitrogen-oxygen atmosphere is so different from the CO2-nitrogen environments on Venus and Mars? Let’s brainstorm — shout out non-atmospheric ways that Earth is unique. I’ll record your list on Al’s whiteboard.”

“Oceans!”

“Plate tectonics!”

“Photosynthesis!”

“Limestone!”

“The Moon!”

“Wombats!” (That suggestion gets a glare from Cathleen. She doesn’t write it down.)

“Goldilocks zone!”

“Magnetic field!”

“People!”

She registers the last one but puts parentheses around it. “This one’s literally a quickie — real-world proof that human activity affects the atmosphere. Since the 1900s gaseous halogen-carbon compounds have seen wide use as refrigerants and solvents. Lab-work shows that these halocarbons catalyze conversion of ozone to molecular oxygen. In the 1970s satellite data showed a steady decrease in the upper-atmosphere ozone that blocks dangerous solar UV light from reaching us on Earth’s surface. A 1987 international pact banned most halocarbon production. Since then we’ve seen upper-level ozone concentrations gradually recovering. That shows that things we do in quantity have an impact.”

“How about carbon dioxide and methane?”

“That’s a whole ‘nother topic we’ll get to some other day. Right now I want to stay on the Mars-Venus-Earth track. Every item on our list has been cited as a possible contributor to Earth’s atmospheric specialness. Which ones link together and how?”

Adopted from image by Immanuel Giel, CC BY-SA 3.0

Astronomer-in-training Jim volunteers. “The Moon has to come first. Moon-rock isotope data strongly implies it condensed from debris thrown out by a huge interplanetary collision that ripped away a lot of what was then Earth’s crust. Among other things that explains why the Moon’s density is in the range for silicates — only 60% of Earth’s density — and maybe even why Earth is more dense than Venus. Such a violent event would have boiled off whatever atmosphere we had at the time, so no surprise the atmosphere we have now doesn’t match our neighbors.”

Astrophysicist-in-training Newt Barnes takes it from there. “That could also account for why only Earth has plate tectonics. I ran the numbers once to see how the Moon’s volume matches up with the 70% of Earth’s surface that’s ocean. Assuming meteor impacts grew the Moon by 10% after it formed, I divided 90% of the Moon’s present volume by 70% of Earth’s surface area and got a depth of 28 miles. That’s nicely within the accepted 20-30 mile range for depth of Earth’s continental crust. It sure looks like our continental plates are what’s left of the Earth’s original crust, floating about on top of the metallic magma that Earth held onto.”

Jeremy gets excited. “And the oceans filled up what the continents couldn’t spread over.”

“That’s the general idea.”

Al’s not letting go. “But why does Earth have so much water and why is it the only one of the three with a substantial magnetic field?”

Cathleen breaks in. “The geologists are still arguing about whether Earth’s surface water was delivered by billions of incoming meteorites or was expelled from deep subterranean sources. Everyone agrees, though, that our water is liquid because we’re in the Goldilocks zone. The water didn’t steam away as it probably did on Venus, or freeze below the surface as it may have on Mars. Why the magnetic field? That’s another ‘we’re still arguing‘ issue, but we do know that magnetic fields protect Earth and only Earth from incoming solar wind.”

“So we’re down to photosynthesis and … limestone?”

“Photosynthesis was critical. Somewhere around two billion years ago, Earth’s sea-borne life-forms developed a metabolic pathway that converted CO2 to oxygen. They’ve been running that engine ever since. If Earth ever did have CO2 like Venus has, green things ate most of it. Some of the oxygen went to oxidizing iron but a lot was left over for animals to breathe.”

“But what happened to the carbon? Wouldn’t life’s molecules just become CO2 again?”

“Life captures carbon and buries it. Chalky limestone, for instance — it’s calcium carbonate formed from plankton shells.”

Jim grins. “We owe it all to the Moon.”

~~ Rich Olcott

Traces of Disparity

Cathleen’s an experienced teacher — she knows when off-topic class discussion is a good thing, and when to get back to the lesson plan. “My challenge question remains — why isn’t Earth’s atmosphere some average of the Mars and Venus ones? Thanks to Jeremy and Newt and Lenore we have reason to expect the planets to resemble each other, but in fact their atmospheres don’t. Maria, tell us what you’ve found about how Earth compares with the others.”

“Yes, Profesora. I found numbers for many of the gasses on each planet and put them into this chart. One thing Earth is right in the middle, most things not.”

“That’s a complicated chart. Read it out to us.”

“Of course. I had to make the vertical scales logarithmic to get the big numbers and small numbers on the same chart. First is the pressure which is the black dotted line. Venus pressure at the surface is nearly 100 times ours but Mars pressure is a bit less than 1/100th of ours. Does that count as Earth being in the middle?”

“That’d be a geometric average. It could be significant, we’ll see. Go on.”

“The gas that is almost the same everywhere is helium, the grey diamonds. That surprised me, because I thought the giant planets got all of that.”

Al’s been listening in. Nothing else going on in his coffee shop, I guess. “I’ll bet most of that helium came from radioactive rocks, not from space. Alpha particles, right, Cathleen?”

Cathleen takes unexpected interruptions in stride. “Bad bet, Al. Uranium and other heavy elements do emit alphas which pick up electrons to become helium atoms. You probably remembered Cleve and Langlet, who first isolated helium from uranium ore. However, the major source of atmospheric alphas is the solar wind. Solar wind interception and atmosphere mass are both proportional to planetary surface area so a constant concentration like this is reasonable. Continue, Maria.”

“The major gasses follow a pattern — about the same fractions on Venus and Mars but much higher or lower than on Earth. Look at carbon dioxide, nitrogen, even oxygen.”

Astronomer-in-training Jim has been doing some mental arithmetic. “Our atmosphere is 100 times denser than on Mars, and Venus is another factor of 100 beyond that. That’s a factor of 104 between them — for every molecule of CO2 on Mars there’s 10,000 on Venus. Oh, but Venus has four times Mars’ surface area so make that 40,000.”

“Good points, both of you. Jim’s approximation leads into something we can learn from Maria’s trace gas numbers. Why do you suppose the concentration of SO2 is about the same for Earth and Mars but 100 times higher on Venus, but the reverse is true for argon? Where do they each come from?”

Jeremy finally has something he can contribute. “Volcanoes! They told us in Geology class that most of our SO2 comes from volcanoes. Before the Industrial Revolution, I mean, when we started burning high-sulfur coal and fuel oils and made things worse. Venus has to be the same. Except for the industry, of course.”

“Probably correct, Jeremy. From radar mapping of Venus we know that it has over 150 large volcanoes. We don’t know how many of them are active, but the Venus Express spacecraft sent back evidence of active vulcanism. In fact, Venus’ SO2 score would probably be even higher if much of its production didn’t oxidize to SO3. That combines with water to form the clouds of sulfuric acid that hide the planet’s surface and reflect sunlight so brightly.”

Maria’s hand is up again. “I don’t understand argon’s purple diamonds, profesora. I know it’s one of the inert gasses so it doesn’t have much chemistry and can’t react into a mineral like CO2 and SO2 can. Shouldn’t argon be about the same on all three planets, like helium?”

“Mm-hm, argon does have a simple chemistry, but its radiochemistry isn’t so simple. Nearly 100% of natural argon is the argon-40 isotope created by radioactive decay of potassium-40. Potassium is tied up in the rocks, so the atmospheric load of argon-40 depends on rocky surface erosion. Not much erosion, not much argon.”

Al’s on tenterhooks. “All this is nice, but you still haven’t said why Earth’s atmosphere is so different.”

~~ Rich Olcott

The Still of The Night

Lenore raises her hand. “Maybe it’s my Chemistry background, but to me that protosolar disk model for the early Solar System looks like a distillation process. You heat up a mixture in the pot and then run the resulting vapors through a multi-stage condenser. Different components of the mixture collect at different points in the condenser depending on the local temperature or maybe something about the condenser’s surface. I got some fun correlations from data I dug up related to that idea.”

“Interesting perspective, Lenore You’re got the floor.”

“Thanks, Professor. Like Newt said, hydrogen and helium atoms are so light that even a low-energy photon or solar wind particle can give them a healthy kick away from the Sun and they wind up orbiting where the gas planets grew up. But there was more sorting than that. Check out this chart.”

“What’re the bubbles?”

“Each bubble represents one planet. I’ve scaled the bubble to show what fraction of the planet is its nickel-iron core. Mercury, for instance, is two-thirds core; the other third is its silicate crust and that’s why its overall density is up there between iron and silicates. Then you go through Venus and Earth, all apparently in the zone where gravity’s inward pull on heavy dust particles is balanced by the solar wind’s intense outward push. From the chart I’d say that outbound metallic and rocky materials are mostly gone by the asteroid belt. Big Jupiter grabs most of the the hydrogen and helium; its little brothers get the leavings. Mars looks like it’s right on the edge of the depletion zone — the numbers suggest that its core, if it has one, is only 12% of its mass.”

Jeremy’s ears prick up. “If it has one?”

“Yeah, the sources I checked couldn’t say for sure whether or not it does. That’s part of why we sent the Insight lander up there. Its seismic data should help decide the matter. With such a small iron content the planet could conceivably have cooled like silicate raisin bread. It might have isolated pockets of iron here and there instead of gathered in at the center.”

“Weird. So the giant planets are all — wait, what’s Saturn doing with a density below water’s?”

“You noticed that. Theoretically, if you could put Saturn on a really big pool of water in a gravity field it’d float.”

Meanwhile, astrophysicist-in-training Newt Barnes has been inspecting the chart. “Uranus and Neptune don’t fit the pattern, Lenore. If it’s just a matter of ‘hydrogen flees farthest,’ then those two ought to be as light as Saturn, maybe lighter.”

“Yeah, that bothered me, too. Uranus and Neptune are giant planets like Jupiter and Saturn, but they’re not ‘gas giants,’ they’re ‘ice giants.’ All four of them seem to have a junky nickel-iron-silicate core, maybe 1-to-10 times Earth’s mass, but aside from that the gas giants are mainly elemental hydrogen and helium whereas Uranus and Neptune are mostly compounds of oxygen, nitrogen and carbon with hydrogen.”

“How’d all those light atoms get so far out beyond the big guys?”

“Not a clue. Can you help, Professor?”

Cathleen draws ellipses on Al’s whiteboard. “Maybe they did, maybe they didn’t — the jury’s still out. We’re used to our nice neat modern Solar System where almost everything follows nearly circular orbits. It took a while to evolve there starting from the chaotic protosolar disk. Many of the early planetesimals probably had narrow elliptical orbits if they had an orbit at all, considering how often they collided with each other. Astromechanics modelers have burned years of computer time trying to account for what we know of the planets, asteroids, comets and the Kuiper and Oort formations we’ve barely begun to learn about. Some popular ‘Jumping Jupiter‘ models show Jupiter and Saturn migrating in towards the Sun and out again, playing hob with Uranus, Neptune and maybe a third ice giant before that one was ejected from the system altogether. It’s entirely possible that the ice giants grew up Sunward of the hydrogen-rich gas giants. We just don’t know.”

“That’s a challenge.”

“Yes, and my challenge question remains — why isn’t Earth’s atmosphere some average of the Mars and Venus ones?”

~~ Rich Olcott

Should These Three Be Alike?

“What’s all the hubbub in the back room, Al? I’m a little early for my afternoon coffee break and your shop’s usually pretty quiet about now.”

“It’s Cathleen’s Astronomy class, Sy. The department double-booked their seminar room so she asked to use my space until it’s straightened out.”

“Think I’ll eavesdrop.” I slide in just as she’s getting started.

“OK, folks, settle. Last class I challenged you with a question. Venus and Mars both have atmospheres that are dominated by carbon dioxide with a little bit of nitrogen. Earth is right in between them. How come its atmosphere is so different? I gave each of you a piece of that to research. Jeremy, you had the null question. Should we expect Earth’s atmosphere to be about the same as the other two?”

Venus coudtops image by Damia Bouic
JAXA / ISAS / DARTS / Damia Bouic

“I think so, ma’am, on the basis of the protosolar nebula hypothesis. The –“

“Wait a minute, Jeremy. Sy, I saw you sneak in. Jeremy, explain that term to him.”

“Yes’m. Uh, a nebula is a cloud of gas and dust out in space. It could be what got shot out of an exploding star or it could be just a twist in a stream of stuff drifting through the Galaxy. If the twist kinks up, gravity pulls the material on either side of the kink towards the middle and you get a rotating disk. Most of what’s in the disk falls towards its center. The accumulated mass at the center lights up to be a star. Meanwhile, what’s left in the disk keeps most of the original angular momentum but it doesn’t whirl smoothly. There’s going to be local vortices and they attract more stuff and grow up to be planets. That’s what we think happens, anyway.”

“Good summary. So what does that mean for Mars, Venus and the Earth?”

“Their orbits are pretty close together, relative to the disk’s radius, so they ought to have encountered about the same mixture of heavy particles and light ones while they were getting up to size. The light ones would be gas atoms, mostly hydrogen and helium. Half the other atoms are oxygen and they’d react to produce oxides — water, carbon monoxide, grains of silica and iron oxide. And oxygen and nitrogen molecules, of course.”

“Of course. Was gravity the only actor in play there?”

“No-o-o, once the star lit up its photons and solar wind would have pushed against gravity.”

“So three actors. Would photons and solar wind have the same effect? Anybody?”

Silence, until astrophysicist-in-training Newt Barnes speaks up. “No, they’d have different effects. The solar wind is heavy artillery — electrons, protons, alpha particles. They’ll transfer momentum to anything they hit, but they’re more likely to hit a large particle like a dust grain than a small one like an atom. On average, the big particles would be pushed away more.”

“And the photons?”

“A photon is selective — it can only transfer momentum to an atom or molecule that can absorb exactly the photon’s energy. But each kind of atom has its own set of emission and absorption energies. Most light emitted by transitions within hydrogen atoms won’t be absorbed by anything but another hydrogen atom. Same thing for helium. The Sun’s virtually all hydrogen and helium. The photons they emit would move just those disk atoms and leave the heavier stuff in place.”

“That’s only part of the photon story.”

“Oh? Oh, yeah. The Sun’s continuous spectrum. The Sun is hot. Heat jiggles whole ions. Those moving charges produce electromagnetic waves just like charge moving within an atom, but heat-generated waves can have any wavelength and interact with anything. They can bake dust particles and decompose compounds that contain volatile atoms. Then those atoms get swept away in the general rush.”

“Which has the greater effect, solar wind or photons?”

“Hard to say without doing the numbers, but I’d bet on the photons. The metal-and-silicate terrestrial planets are close to the Sun, but the mostly-hydrogen giants are further out.”

“All that said, Jeremy, what’s your conclusion?”

“It sure looks like Earth’s atmosphere should be intermediate between Mars and Venus. How come it’s not?”

~~ Rich Olcott

The Big Chill

Jeremy gets as far as my office door, then turns back. “Wait, Mr Moire, that was only half my question. OK, I get that when you squeeze on a gas, the outermost molecules pick up kinetic energy from the wall moving in and that heats up the gas because temperature measures average kinetic energy. But what about expansion cooling? Those mist sprayers they set up at the park, they don’t have a moving outer wall but the air around them sure is nice and cool on a hot day.”

“Another classic Jeremy question, so many things packed together — Gas Law, molecular energetics, phase change. One at a time. Gas Law’s not much help, is it?”

“Mmm, guess not. Temperature measures average kinetic energy and the Gas Law equation P·V = n·R·T gives the total kinetic energy for the n amount of gas. Cooling the gas decreases T which should reduce P·V. You can lower the pressure but if the volume expands to compensate you don’t get anywhere. You’ve got to suck energy out of there somehow.”

Illustrations adapted from drawings by Trianna

“The Laws of Thermodynamics say you can’t ‘suck’ heat energy out of anything unless you’ve got a good place to put the heat. The rule is, heat energy travels voluntarily only from warm to cold.”

“But, but, refrigerators and air conditioners do their job! Are they cheating?”

“No, they’re the products of phase change and ingenuity. We need to get down to the molecular level for that. Think back to our helium-filled Mylar balloon, but this time we lower the outside pressure and the plastic moves outward at speed w. Helium atoms hit the membrane at speed v but they’re traveling at only (v-w) when they bounce back into the bulk gas. Each collision reduces the atom’s kinetic energy from ½m·v² down to ½m·(v-w)². Temperature goes down, right?”

“That’s just the backwards of compression heating. The compression energy came from outside, so I suppose the expansion energy goes to the outside?”

“Well done. So there has to be something outside that can accept that heat energy. By the rules of Thermodynamics, that something has to be colder than the balloon.”

“Seriously? Then how do they get those microdegree above absolute zero temperatures in the labs? Do they already have an absolute-zero thingy they can dump the heat to?”

“Nope, they get tricky. Suppose a gas in a researcher’s container has a certain temperature. You can work that back to average molecular speed. Would you expect all the molecules to travel at exactly that speed?”

“No, some of them will go faster and some will go slower.”

“Sure. Now suppose the researcher uses laser technology to remove all the fast-moving molecules but leave the slower ones behind. What happens to the average?”

“Goes down, of course. Oh, I see what they did there. Instead of the membrane transmitting the heat away, ejected molecules carry it away.”

“Yup, and that’s the key to many cooling techniques. Those cooling sprays, for instance, but a question first — which has more kinetic energy, a water droplet or the droplet’s molecules when they’re floating around separately as water vapor?”

“Lessee… the droplet has more mass, wait, the molecules total up to the same mass so that’s not the difference, so it’s droplet velocity squared versus lots of little velocity-squareds … I’ll bet on the droplet.”

“Sorry, trick question. I left out something important — the heat of vaporization. Water molecules hold pretty tight to each other, more tightly in fact than most other molecular substances. You have to give each molecule a kick to get it away from its buddies. That kick comes from other molecules’ kinetic energy, right? Oh, and one more thing — the smaller the droplet, the easier for a molecule to escape.”

“Ah, I see where this is going. The mist sprayer’s teeny droplets evaporate easy. The droplets are at air temperature, so when a molecule breaks free some neighbor’s kinetic energy becomes what you’d expect from air temperature, minus break-free energy. That lowers the average for the nearby air molecules. They slow their neighbors. Everything cools down. So that’s how sprays and refrigerators and such work?”

“That’s the basic principle.”

“Cool.”

~ Rich Olcott

Thanks to Mitch Slevc for the question that led to this post.