A Thumbtack in A Needlestack

“What’re the odds?”

“Odds on what, Vinnie?”

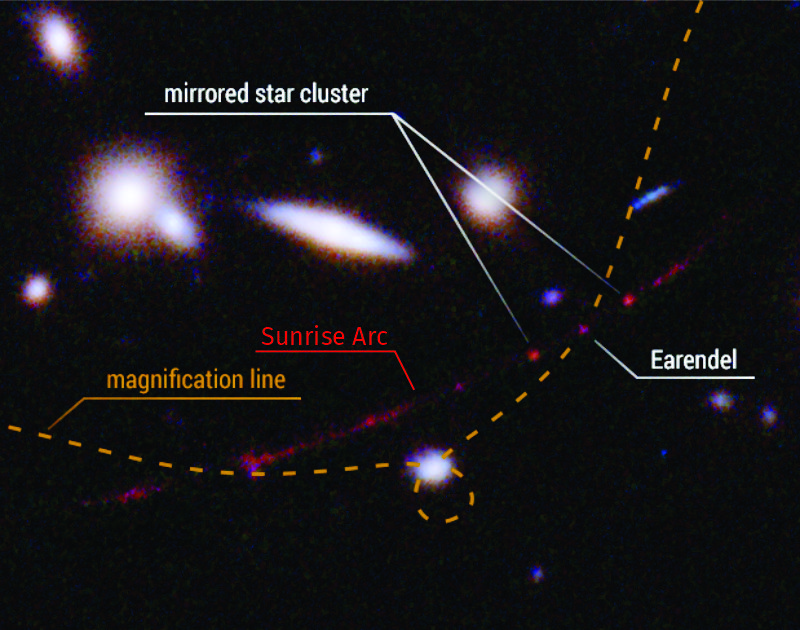
“A gazillion galaxies out there, only 41 lensing galaxy clusters, but one of them shows us a singleton star. I mean, what’s special about that star? What are the odds?”

I can’t help it. “Astronomical, Vinnie.”

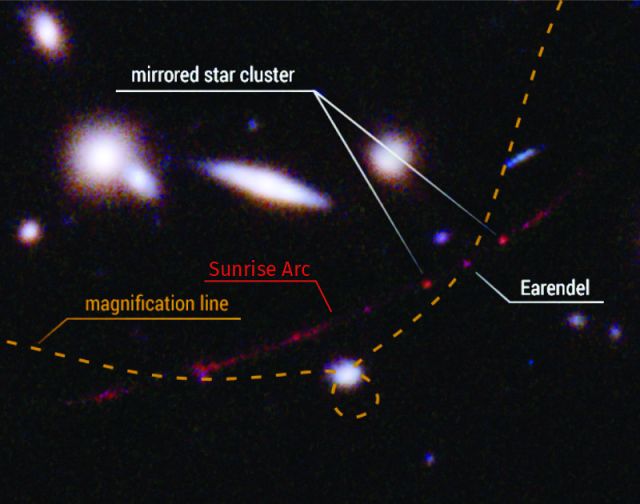
Cathleen punches my shoulder, hard. “Sy Moire, you be ashamed of yourself. That pun was ancient a century ago. Vinnie, the odds are better than they seem. We didn’t just stumble on Earendel and the Sunrise Arc, we found them in a highly targeted Big Data search for things just like that — objects whose light was extremely stretched and also gravitationally bent in our direction. The Arc’s lensing galaxy cluster has a spherical effect, more or less, so it also acts on light from other far-away objects and sends it in other directions. It even bends an image of our Milky Way towards Earendel’s galaxy.”

“I call weaseling — you used ‘more or less‘.”

“Guilty as charged, Vinnie. A nice, spherical black hole is the simplest case of gravitational lensing — just one mass at the center of its simple light‑bending gravity field. Same thing for a single star like our Sun. Clusters are messy. Tens or hundreds of billion‑star galaxies, scattered at random angles and random positions about their common center of mass. The combined gravity field is lumpy, to say the least. Half of that research paper is devoted to techniques for estimating the field and its effects on light in the region around the Arc.”

“I guess they had to get 3D positions for all the galaxies in the cluster. That’d be a lot of work.”

“It would, Al, but that’s beyond what current technology can do. Instead, they used computer models to do — get this, Sy — curve fitting.”

<chuckle> “Good one, Cathleen.”

“What’s so funny?”

“There’s a well-established scientific technique called ‘curve fitting.’ You graph some data and try to find an equation that does a respectable job of running through or at least near your data points. Newton started it, of course. Putting it in modern terms, he’d plot out some artillery data and say, ‘Hmm, that looks like a parabola H=h+v·t+a·t2. I wonder what values of h, v and a make the H-t curve fit those measurements. Hey, a is always 32 feet per second per second. Cool.’ Or something like that. Anyhow, Cathleen’s joke was that the researchers used curve fitting to fit the Sunrise Arc’s curve, right?”

“They did that, Sy. The underlying physical model, something called ‘caustic optics,’ says that—”

“Caustic like caustic soda? I got burnt by that stuff once.”

Image by Heiner Otterstedt,
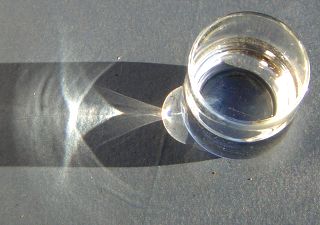
under the Creative Commons Attribution-Share Alike 3.0 Unported license

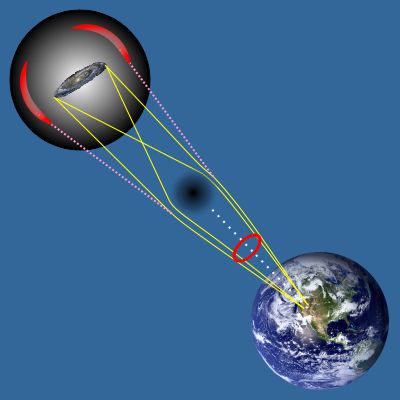
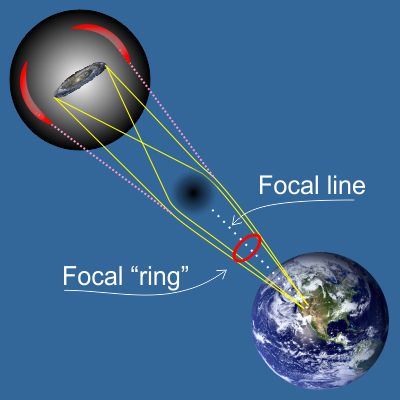
“That’s the old name for sodium hydroxide, Vinnie. It’s a powerful chemical and yeah, it can give you trouble if you’re not careful. That name and caustic optics both come from the Greek word for burning. The optics term goes back to using a lens as a burning glass. See those focused patterns of light next to your water glass? Each pattern is a caustic. The Arc’s lensing cluster’s like any light‑bender, it’s enclosed in a caustic perimeter. Light passing near the perimeter gets split, the two parts going to either side of the perimeter. The Earendel team’s curve‑fitting project asked, ‘Where must the caustic perimeter be to produce these duplicate galaxy images neighboring the Arc?‘ The model even has that bulge from the gravity of a nearby foreground galaxy.”

“And the star?”

“Earendel seems to be smack on top of the perimeter. Any image touching that special line is intensified way beyond what it ought to be given the source’s distance from us. It’s a pretty bright star to begin with, though. Or maybe two stars.”

“Wait, you don’t know?”

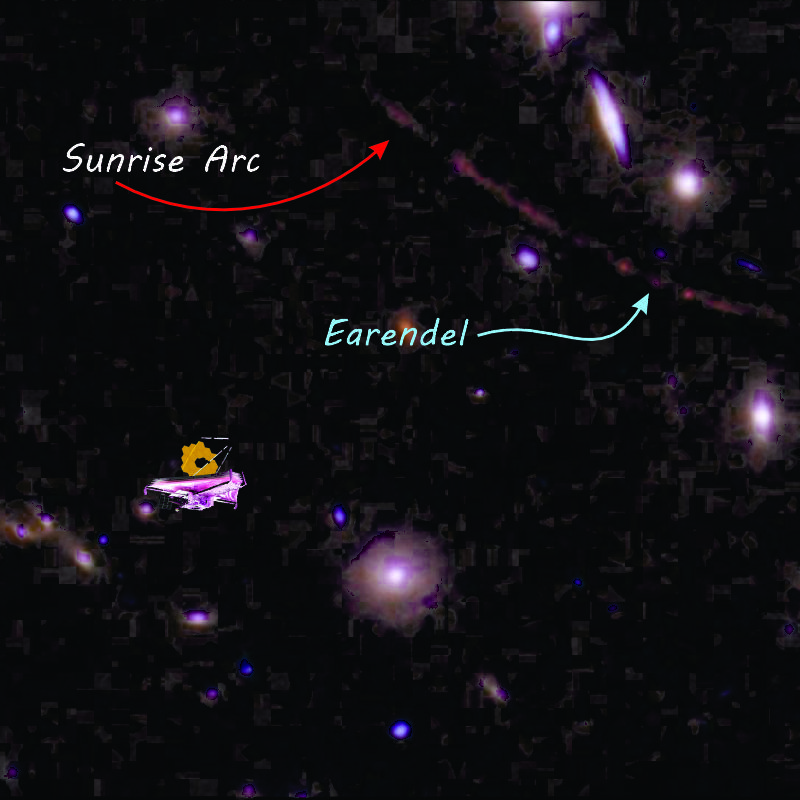
“Not yet. This study pushed the boundaries of what Hubble can do for us. We’re going to need JWST‘s infrared instruments to nail things down.”

Al’s in awe. “Wow — that caustic’s sharp enough to pick one star out of a galaxy.”

“Beat the astronomical odds, huh?”

Adapted from a public-domain image.
Credit: Science: NASA / ESA / Brian Welch (JHU) / Dan Coe (STScI); Image processing: NASA / ESA / Alyssa Pagan (STScI)

~~ Rich Olcott

A Needle in A Needlestack

“How’d they find that far-away star, Cathleen? Seems like you’d have to know just where to point your telescope.”

“It’s worse than that, Al, first you’ve got to find that telescope, or more precisely, its lens. We can’t simply swing a black hole or galaxy cluster into position for a good look at something interesting. No, we have to discover lensing objects that magnify good stuff beyond them. The good news is that some of those are out there, but the bad news is that the sky is cluttered with far more objects that don’t play the game we want. This research team appears to have hit paydirt but they did it with humungous power shovels and heavy‑duty panning techniques.”

“Impressive metaphor, Cathleen. Could you un‑metaphor it for us?”

“Sure, Sy. The power shovels are Hubble and Spitzer, both of which piled up beaucoodles of data from decades of infrared observing time.”

“I thought Hubble was designed for visible and UV surveillance.”

“It is, mostly, but since 2009 its instrument suite included WFC3, a camera that’s sensitive out to 1700 nanometers and covers a square 2 arcminutes on a side. That’s a lot, by big‑telescope astronomy standards.”

“Wait, arcminutes?”

“That’s right, Mr Feder. We astronomers have trouble with distances but we’re good at measuring angles. The Moon’s about a degree across. One degree is sixty arcminutes, next step down is sixty arcseconds per arcminute. After that we go semi‑metric, milliarcseconds and so forth. One WFC3 pixel records a patch of sky 130 milliarcseconds across. JWST‘s NIRCam instrument has a resolution twice as sharp. Anyway, Hubble‘s 1700‑nanometer limit is plenty good enough to pick up 120‑nanometer hydrogen light that’s been stretched out by a factor of z=2.8. Distance and stretch correlate; the lens that highlighted Earendel and its Sunrise Arc for NASA and Vinnie is that far away.”

“How far away?”

“It’s tricky to answer that. The spectra we see let us measure an object’s z‑factor, which by way of the Doppler effect tells us how fast the object is moving away. Hubble’s constant ties that to distance, sort of. My convenient rule of thumb is that an object whose z is near 2 is running away at 80% of lightspeed and on the average is about 55 trillion lightyears from us but don’t quote me because relativity complicates matters. Using the same dicey calculation I estimated the lens and Earendel velocities at 87% and 96% of lightspeed, which would put their ‘proper distances‘ around 60 and 66 trillion lightyears away. And no, I’m not going to go into ‘proper distance‘ versus ‘comoving distance‘.”

“Let’s get back to your metaphor, Cathleen. I get that Hubble and Spitzer and such generated a ton of data. What’s the panning part about?”

“Well, in the old days it would have been hired hands and graduate students spending years peering at dots on photographic plates. These days it’s computers, thank Heaven. The research team used a series of programs to filter their digital data. The software had to decide which dots are stars or noise specks and which are galaxies or arcs. Then it picked out the reddest red galaxy images, then clusters of galaxy images at the same redness level that are near each other in space, then clusters with arcs around them. I said that WFC3 covers a square 2 arcminutes on a side, remember? The sky, both hemispheres, contains almost 2½ million squares like that, although the surveys didn’t get all of them. Anyhow, after burning through cubic acres of computer time the team found 41 deep red lensing clusters.”

“Only 41.”

“Yup.”

We ponder that for a minute, then Vinnie pipes up. “Wait, the dots are in color?”

“No, but these images are generally taken through a filter that transmits only a known narrow wavelength range, infrared or whatever. Using relative dot intensity at several different wavelengths you can create ‘false color‘ images. When you find something, you know where to point spectroscopic tools to be sure you’ve found the good stuff.”

“Like a star shining less than a billion years after the Big Bang.”

“Paydirt.”

Image adapted from NASA and STScI

~~ Rich Olcott

When The Stars Are Aligned Right

Cathleen and I are chatting when Vinnie bursts into the coffee shop waving a newspaper. “New news, guys, they’ve just announced Hubble spotted the farthest‑away star. How about that? Think what JWST will be able to do!”

Cathleen raises an eyebrow. “Sounds like press release science. What else do they say?”

“Not a whole lot. Lessee… These guys went through old Hubble data and found a piece of an Einstein ring which I don’t know what that is and partway along the ring is a star and somehow they figured out it’s 50 times heavier than the Sun and 12 billion years old and it’s the farthest star they’ve ever seen and that’s why NASA’s all excited.”

“Do you believe all that?”

“Maybe the NASA PR people do?”

“Maybe. I just read the technical paper behind that announcement. The authors themselves aren’t absolutely sure. The paper’s loaded with supporting evidence and ‘how we did it‘ details but it’s also loaded with caveats. The text includes a string of alternative explanations for their observations, winding up with a typical ‘we await further evidence from JWST‘ statement. Reads a lot more like real science. Besides, we’ve already seen more distant stars but they’re all jumbled together inside their very distant galaxies.”

“Unpack it for me. Start with what’s an Einstein ring?”

“It’s a gravitational lensing effect. Sy, does Old Reliable still have a copy of that graphic you did about gravitational lensing?”

“That was years ago. Let me check… Uh‑huh, here it is.”

“Thanks. Vinnie, you know how a prism changes light’s direction.”

“Sy and me, we talked about how a prism bends light when light crosses from air to glass or the other way ’cause of the different speed it goes in each material. Uhh, if I remember right the light bends toward the slower speed, and you get more bend with shorter wavelengths.”

“Bingo, Vinnie. Gravitational lensing also bends light, but the resemblance ends there. The light’s just going through empty space, not different media. What varies is the shape of spacetime itself. Say an object approaches a heavy mass. Because of relativity the space it moves through appears compressed and its time is dilated. Compressed distance divided by dilated time means reduced velocity. Parts of a spread‑out lightwave closest to the mass slow down more than parts further way so the whole wave bends toward the heavy mass. Okay?”

“Hold on. Umm, so in your picture light coming towards us from that galaxy doesn’t get blocked by that black thingy, the light bends around it on both sides and focuses in on us?”

“Exactly. Now carry it further. The diagram cuts a flat 2D slice along round 3D spatial reality. Those yellow lines really are cones. Three‑sixty degrees around the black blob, the galaxy’s light bends by the same amount towards the line between us and the blob. Your Einstein ring is a cut across the cone, assuming that the galaxy, the blob and Earth are all exactly on the same straight line. If the galaxy’s off‑center the picture isn’t as pretty — you only get part of a ring, like those red arcs in Sy’s diagram.”

“A galactic rainbow. That ought to be awesome!”

“Well it would be, but there’s another difference between prisms and blobs. Rainbows happen because prisms and raindrops bend short‑wavelength colors more than longer ones, like you said. Gravitational lensing doesn’t care about wavelength. Wavelengths do shift as light traverses a gravitational well but the outbound red shift cancels the inbound blue shift.. Where gravity generates an Einstein ring, all wavelengths bend through the same angle. Which is a good thing for bleeding‑edge astronomy researchers.”

“Why’s that, Cathleen?”

“If the effect were wavelength‑dependent we’d have aberration, the astronomer’s nemesis. Images would be smeared out. As it is, all the photons from a point hit the same spot on the sensor and we’ve got something to see.”

“Tell him about amplification, Cathleen.”

“Good point, Sy. Each galactic star emits light in every direction. In effect, the blob collects light over its entire surface area and concentrates that light along the focal line. We get the brightest image when the stars are aligned right.”

~~ Rich Olcott

Now And Then And There

Still at our table in Al’s otherwise empty coffee shop. We’re leading up to how Physics scrambled Now when a bell dings behind the counter. Al dashes over there. Meanwhile, Cathleen scribbles on a paper napkin with her colored pencils. She adds two red lines just as Al comes back with a plate of scones. “Here, Sy, if you’re going to talk Minkowski space this might be useful.”

“Hah, you’re right, Cathleen, this is perfect. Thanks, Al, I’ll have a strawberry one. Mmm, I love ’em fresh like this. OK, guys, take a look at Cathleen’s graphy artwork.”

“So? It’s the tile floor here.”

“Not even close, Mr Feder. Check the labels. The up‑and‑down label is ‘Time’ with later as higher. The diagram covers the period we’ve been sitting here. ‘Now‘ moves up, ‘Here’ goes side‑to‑side. ‘Table‘ and ‘Oven‘, different points in space, are two parallel lines. They’re lines because they both exist during this time period. They’re vertical because neither one moves from its relative spatial position. Okay?”

“Go on, Moire.”
  ”Makes sense to me, Sy.”

“Good. ‘Bell‘ marks an event, a specific point in spacetime. In this case it’s the moment when we here at the table heard the bell. I said ‘spacetime‘ because we’re treating space and time as a combined thing. Okay?”

“Go on, Moire.”
  ”Makes sense to me, Sy.”

“So then Al went to the oven and came back to the table. He traveled a distance, took some time to do that. Distance divided by time equals velocity. ‘Table‘ has zero velocity and its line is vertical. Al’s line would tilt down more if he went faster, okay?”

“Mmmm, got it, Sy.”
  ”Cute how you draw the come-back label backwards, lady. Go on, Moire.”

“I do my best, Mr Feder.”

“Fine, you’ve got the basic ideas. Now imagine all around us there’s graph paper like this — except there’s no paper and it’s a 4‑dimensional grid to account for motion in three spatial dimensions while time proceeds. Al left and returned to the same space point so his spacetime interval is just the time difference. If two events differ in time AND place there’s special arithmetic for calculating the interval.”

“So where’s that get us, Moire?”

“It got 18th and 19th Century Physics very far, indeed. Newton and everyone after him made great progress using math based on a nice stable rectangular space grid crossed with an orderly time line. Then Lorentz and Poincaré and Einstein came along.”

“Who’s Poincaré?”

“The foremost mathematician of nineteenth Century France. A mine safety engineer most days and a wide‑ranging thinker the rest of the time — did bleeding‑edge work in many branches of physics and math, even invented a few branches of his own. He put Lorentz’s relativity work on a firm mathematical footing, set the spacetime and gravity stage for Minkowsky and Einstein. All that and a long list of academic and governmental appointments but somehow he found the time to have four kids.”

“A ball of fire, huh? So what’d he do to Newton’s jungle gym?”

“Turned its steel rod framework into jello. Remember how Cathleen’s Minkowski diagram connected slope with velocity? Einstein showed how Lorentz’s relativity factor sets a speed limit for our Universe. On the diagram, that’d be a minimum slope. Going vertical is okay, that’s standing still in space. Going horizontal isn’t, because that’d be instantaneous travel. This animation tells the ‘Now‘ story better than words can.”

“Whah?”
  ”Whah?”

“We’re looking down on three space travelers and three events. Speeds below lightspeed are within the gray hourglass shape. The white line perpendicular to each traveler’s time line is their personal ‘Now‘. The travelers go at different velocities relative to us so their slopes and ‘Now‘ lines are different. From our point of view, time goes straight up. One traveler is sitting still relative to us so its timeline is marked ‘v=0‘ and parallels ours. We and the v=0 traveler see events A, B and C happening simultaneously. The other travelers don’t agree. ‘Simultaneous‘ is an illusion.”

~~ Rich Olcott