

Afternoon coffee time. Cal waves a handful of astronomy magazines at us as Cathleen and I enter his shop. “Hey, guys, there’s a ton of black hole stuff in the news all of a sudden.”
Cathleen plucks a scone from the rack. “Not surprised, Cal. James Webb Space Telescope looks harder and deeper than we ever could before and my colleagues have been feasting on the data. Black holes are highly energetic so the most extreme ones show up well. The Hubble and JWST folks find new extremes every week.”
Cal would be disappointed if I didn’t ask. “So what’s the new stuff in there?”
<flipping through the magazines> “This seems to be quasar jet month. We’ve got a new champion jet and this article says M87’s quasar makes novas.”
“Remind me, Cathleen, what’s a quasar?”
“A quasi‑stellar object, Sy, except we now know it’s a galaxy with a supermassive black hole—”
“I thought they all had super‑massives.”
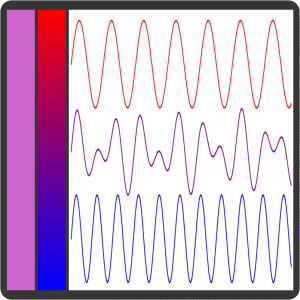
“Most do, but these guys are special. For reasons researchers are still arguing about, they emit enormous amounts of energy, as much as a trillion average stars. Quasar luminosity is more‑or‑less flat all across the spectrum from X-rays down as low as we can measure. Which isn’t easy, because the things are so far away that Universe expansion has stretched their waves by z‑factors of 6 or 8 or more. We see their X‑ray emissions in the infrared range, which is why JWST’s optimized for infrared.”
“What does ‘flat’ tell you?”
“Sy’d give a better answer than I would. Sy?”
“Fun fact, Cal. Neither atoms nor the Sun have flat spectra and for the same reason: confinement. Electromagnetic waves come from jiggling charges, right? In an atom the electron charge clouds are confined to specific patterns centered on the nucleus. Each pattern holds a certain amount of energy. The atom can only move to a different charge pattern by emitting or absorbing a wave whose energy matches the difference between the pattern it’s in and some alternate pattern. Atomic and molecular spectra show peaks at the energies where those transitions happen.”
“But the Sun doesn’t have those patterns.”
“Not in the stepped energy‑difference sense. The Sun’s made of plasma, free electrons and nuclei all bouncing off each other, moving wherever but confined to the Sun’s spherical shape by gravity. Any particle that’s much more or less energetic than the local average eventually gets closer to average by exchanging energy with its neighbors. Free charged particles radiate over a continuous, not stepwise, spectrum of energies. The free‑particle combined spectrum has a single peak that depends on the average temperature. You only get flat spectra from systems that aren’t confined either way.”
“What I get from all that is a jet’s flat spectrum says that its electrons or whatever aren’t confined. But they must be — the things are thin as a pencil for thousands of lightyears. Something’s gotta be holding them together but why no peaks?”
“Excellent question, Cal. By the way, jets can be even longer than you said. I’ve read about your champion jet. It extends 23 million lightyears, more than a hundred times the width of the Milky Way galaxy. Straight as a string, no kinks or wiggles during a billion years of growth. I think what’s going on is that the charged particles are confined side‑to‑side somehow but they’re free to roam along the jet’s axis. If that’s the case, the flat‑spectrum light ought to be polarized. I’m sure someone is working on that test now. Your thoughts, Sy?”
“As a physicist I’m interested in the ‘somehow.’ We only know of four forces. The distances are too big for weak and strong nuclear forces. Gravity’s out, too, because it acts equally in all directions, not just crosswise to the axis. That leaves electromagnetic fields in some super‑strong self‑reinforcing configuration. The particles must be spiraling like mad about that central axis. I’ll bet that explains Cal’s quasar galaxy concentrating novae close to its SMBH jet axis. A field that strong could generate enough interference to wreak havoc on an unstable star’s plasma.”
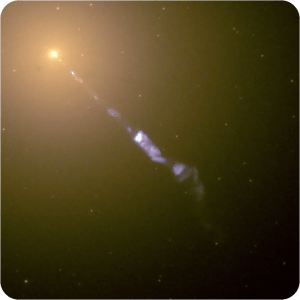
Credit NASA and the Hubble Heritage Team (STScI/AURA)
~ Rich Olcott


 “So you’re telling me, Cathleen, that you can tell how hot a star is by
 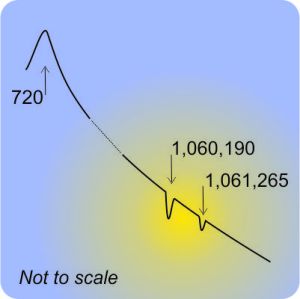 Cathleen turns to her laptop and starts tapping keys. “Let’s do an example. Suppose we’re looking at a star’s broadband spectrogram. The blackbody curve peaks at 720 picometers. There’s an absorption doublet with just the right relative intensity profile in the near infra-red at 1,060,190 and 1,061,265 picometers. They’re 1,075 picometers apart. In the lab, the sodium doublet’s split by 597 picometers. If the star’s absorption peaks are indeed the sodium doublet then the spectrum has been stretched by a factor of 1075/597=1.80. Working backward, in the star’s frame its blackbody peak must be at 720/1.80=400 picometers, which corresponds to a temperature of about 6,500 K.”

 We can investigate things that take longer than an instrument’s characteristic time by making repeated measurements, but we can’t use the instrument to resolve successive events that happen more quickly than that. We also can’t resolve events that take place much closer together than the instrument’s characteristic length.
