Joke Time

<Note to reader — Doing a little Spring cleaning. Here’s a collection of short takes to lighten your mood in these trying times…>


Dark Matter and Dark Energy walked into a bar. No-one noticed.


A baffled young student of Chemistry
Got their enthalpy mixed with their entropy.
         ”Thy’re surely confusing me
         And evilly abusing me
With their Gibbs and their Helmholz free energy.”


Elliptical definitions are even less informative than circular definitions. That’s why politicians prefer them.


There’s an old and well-established (but good-natured) rivalry between major segments of humanity’s Science enterprise. A Mathematician might proclaim that

  • Mathematics is the Queen of the Sciences.
  • Physics is noisy Mathematics.
  • Chemistry is smelly Physics.
  • Biology is squishy Chemistry.
  • Psychology is congealed Biology.
  • Sociology is imprecise Psychology.
  • Archaeology is dusty Sociology.
  • Paleontology is unfocused Archaeology.
  • Geology is Paleontology that you’ve stubbed your toe on.

whereas Chemists would point to the typical number of objects in a study

  • Chemistry — 6×10²³
  • Cell biology — 106 to 109
  • Astronomy — between 8 and a trillion, depending on specialty
  • Whole-body Biology — dozens to hundreds
  • Physics has trouble when there are more than 3
  • Cosmology — one.

Statistics are what we used before we had computer graphics.


Paleontologists have announced the discovery of a previously unknown fossil homid, Homo eructus, also known as “Spitting Man.” The body had been interred along with a copious supply of status goods — shell and polished-stone necklaces, a blade weapon, etc., but also unexpectedly numerous containers of chewing tobacco and a tin cup, hence the species name.


I’d like to thank whoever thought up this call-and-response…
     WHAT DO WE WANT?
         TIME TRAVEL!
     WHEN DO WE WANT IT?
         IT DOESN’T MATTER!


One friend says that coconuts are mammals because they have fur and give milk. Another friend maintains that they’re shellfish. She writes, “Wikipedia says shellfish are ‘exoskeleton-bearing aquatic invertebrates used as food‘. Their husk is the exoskeleton, they’re obviously invertebrates because they have no spine, and they’re aquatic when floating in water or blended into cocktails.”


If the human body is the result of Intelligent Design, how come it’s impossible to reach that itchy spot in the middle of one’s back?


Combining my physics studies and my observations as a museum docent I’ve concluded that there are three ultimate speeds in the Universe
 * the speed of sound
 * the speed of light
 * the speed of a toddler when your back is turned.


The letter “A” is common in English, but you can count from zero to nine-hundred ninety-nine without encountering an “A“. On the other hand, the letter “Z” is uncommon but in Zero it’s at the head of the number line. If you want to cover something from A to Z, you have to count backwards.


Speaking of “Z,” “zero” is the only formal number word that contains a “z.” “Zillion” and “bazillion” don’t count.


I had a really good walk-off line, but that was at 3:00 am and it’s gone.
Dang, I hate it when that happens.
Don’t forget to tip the wait staff.

~~ Rich Olcott

Flattening The Curve

<chirp chirp> My phone’s non-business ring-tone. “Moire here.”

“Hi, Mr Moire, it’s me, Jeremy, again. Sorry for the hold-up. My phone’s on the charger now so we can keep going about the Logistics Curve and all.”

“Logistic Curve, Jeremy, singular. Logistics plural has to do with managing the details of a military or business operation. That’s quite different from population growth which is what the Logistic Curve is about. Though come to think of it, these days we’re seeing a tie‑in. So where were we?”

“We had that S-shaped Logistic Curve with exponential growth at the beginning but then it plateaus and you showed me a humpy curve that’s the slope of the other one and you said the humpy curve is like R = K*S*(N‑S) if N is everybody and S is how many are susceptible to the virus. But you kind of skipped over K.”

“True and I’ll get to K, but that ‘humpy’ curve is important. In the context of the pandemic, it’s people per day — how many catch the virus, how many show up for medical care, how many need ventilators or even mortuary care — there’s a different K for each question. The hump is what we’re trying to get control of. The K factors summarize a whole pipeline of ifs and maybes. Some of them are knobs that we may be able to use to flatten the hump.”

“We can do that? How?”

“Good question. Here, let me send your phone another image. Let me know when you receive it.”

“It’s here, Mr Moire. Looks like you’ve got three Logistic Curves but they’re stretched out different amounts.”

“Stretched out on the time axis, and that’s crucial. I generated those three plots by using different values for K. Sooner or later in all three models everyone catches the bug. In the blue-line case, though, that happens over a much longer time interval than in the red-line case. If you’re a public health official or hospital administrator you pray for the blue-line case — the slow initial rise gives you a heads-up and more time to get ready for future incoming cases. Better yet, because the cases-per-day peak is flatter you don’t need as many masks and ventilators to take of the patients and your front-line people are less likely to be over‑extended. Assuming you’ve hired enough in the first place.”

“So the government wants to reduce the K numbers to get to the blue-line case.”

“Absolutely. Keep in mind, K is such a complicated summary of things that realistic models are complex. Experienced modelers know that the more factors you put into a model, the riskier the predictions become. Anyway some of the things that go into K we can’t control, we can only measure or estimate them and try to account for what’d happen if something changes.”

“Like what?”

“Suppose you’re exposed to the virus. What’s the probability that you’ll come down with symptoms bad enough to need medical care? Current data suggests those odds depend a lot on uncontrollable things like your age and medical history. A model for a retirement community almost certainly needs a different set of K-values then a model for a college town full of teens and twenty-somethings. But that gets into a different cluster of factors.”

“That’s for sure. My grandparents are a lot more careful about their health than my crew is.”

“Which gets us into the K-factors we can at least try to manage. Simple example — you can’t catch the virus if you’re not exposed to it. That’s what Social Distancing is all about and that’s why you’re staying at home, thank you very much. Typically, models gauge that piece by surveying what fraction of the population is complying with the stay-at-home, masking and 6-feet-away rules. We need to get to 70% or better to keep the patients-per-day rate down to what the hospitals can cope with. A vaccine, when we get one, will have the same effect but that’s a year away.”

“Yeah, and if someone invents a good treatment so people don’t have to go on ventilators, that’d help the K for that end of the pipeline.”

“Get to work on it, Jeremy.”

~~ Rich Olcott

The Curve To Be Flattened

<chirp chirp> My phone’s ring-tone for an non-business call. “Moire here.”

“Mr Moire, it’s Jeremy.”

“I hope so, Jeremy, my phone shows your caller-ID. I’m glad you called instead of trying to drop by, the city being under lockdown orders and all. What’s your question?”

“Oh, no question, sir, I just called to chat. It’s lonely over here. If you’ve got the time, anything you’d like to talk about would be fine.”

“Mm… Well, I am working on a project but maybe talking it out will help get my thoughts in order. Have you seen that ‘Flatten the curve‘ chart?”

“Sure, it’s been hard to escape. They use it to tell us why we shouldn’t do group stuff while this virus is going around. Are you writing about where the chart comes from?”

“That’s my project, all right. There’re two ways to get to that chart and I’m trying to decide which will work better. I could start from ecology studies of invading organisms taking over a new territory. At first the organisms multiply rapidly, doubling then doubling again —”

“That’s exponential growth, Mr Moire. We talked about that!”

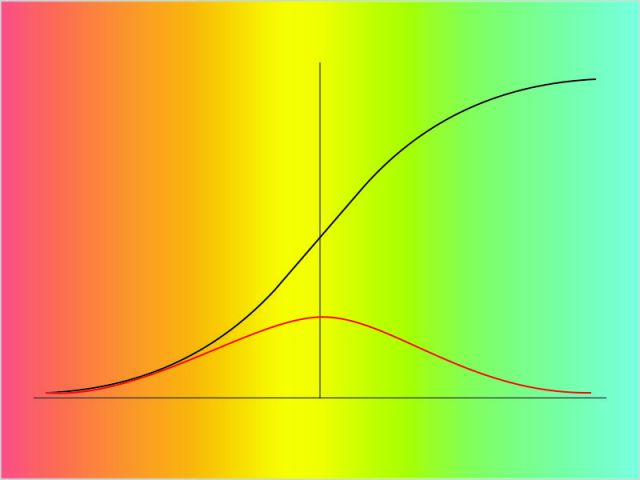
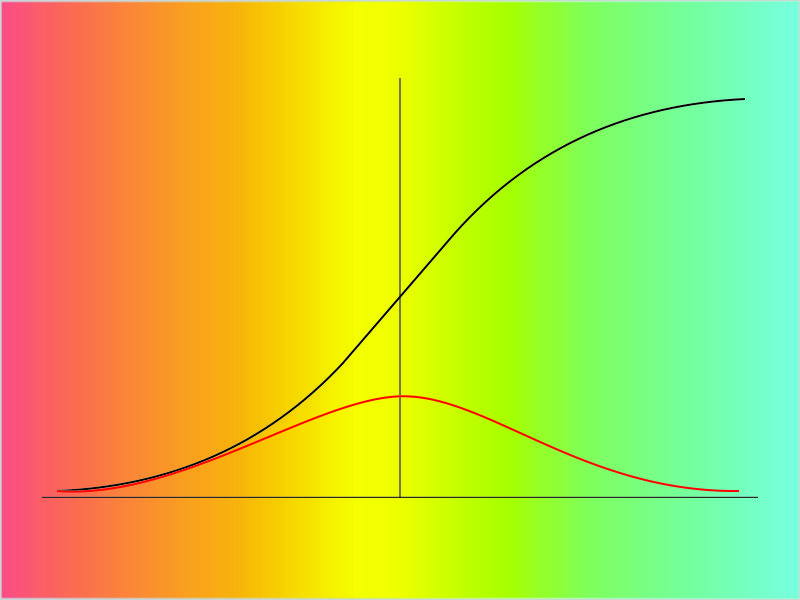
“Just sent you an image. When researchers plot invasions they usually look like the black line, the Logistic Curve. Its height represents the organism’s population as time increases left-to-right. At the beginning there’s that exponential rise. Over on the right the growth rate slows as the plants or animals or bugs use up increasingly scarce resources. The part in the middle’s almost linear. All that’s a familiar story by now, right?”

The Logistic Curve (black) and its slope (red)

“Uh-huh. We talked a lot about ecology back in kid school except we hadn’t learned graphs yet. What’s the red curve?”

“That’s the interesting part I’m trying to write about. One way to look at it is that it’s simply the slope of the Logistic curve. See how where the Logistic is rising, the slope is rising, too? That’s the way exponentials work — ‘the higher the faster‘ as they say. The slope switches direction just where the Logistic switches from growth to slow-down. The Logistic Curve approaches its limit when the organism’s population approaches the carrying capacity of the territory. That’s also where the slope gets shallowest. Very few resources, very little expansion.”

“What’s the other way to look at it?”

“We start with the slope curve itself. It has its own straight-forward interpretation, especially if the organism is a a bacterium or virus that causes disease. Consider the population under attack as the resource. How fast will the disease spread?”

“Uh… what I keep hearing is that if more people get sick, other people will get infected faster.”

“But what happens when nearly everyone’s caught it and they’ve either recovered or left us?”

“Oh, there’ll be fewer people left to catch it so the disease spreads more slowly.”

“Let me put that into algebra. I’ll write N for the total number of people and that’ll be a constant, we hope. At any given time we’ve got S as the current number of people who are susceptible. Then (N‑S) tells us how many people are NOT susceptible. Are you with me?”

“Fine so far.”

“So from what we’ve just said, the rate of infection is low when S is low and also low when (N‑S) is low. One way to make that into an equation is to write the rate as R = K*S*(N‑S). K is just a number we can adjust to account for things like virulence and Social Distance effectiveness. If we plot R against time what shape will it have?”

“Mmm… S is nearly the same as N at the start so (N‑S) is nearly zero then. At the finish, S is nearly zero. Exactly in the middle S equals (N‑S). They each have to be higher than near-zero there. That makes R be low at each end and high in the middle. Ah, that’s sort-of the shape of the slope curve!”

“It’s exactly the shape of the slope curve. So how do we flatten it?”

<click-click, click-click> “Oops, Mr Moire, my phone battery’s about dead. Gotta go get the charger. I’ll be right back.”

“I’ll be here, Jeremy.”

~~ Rich Olcott

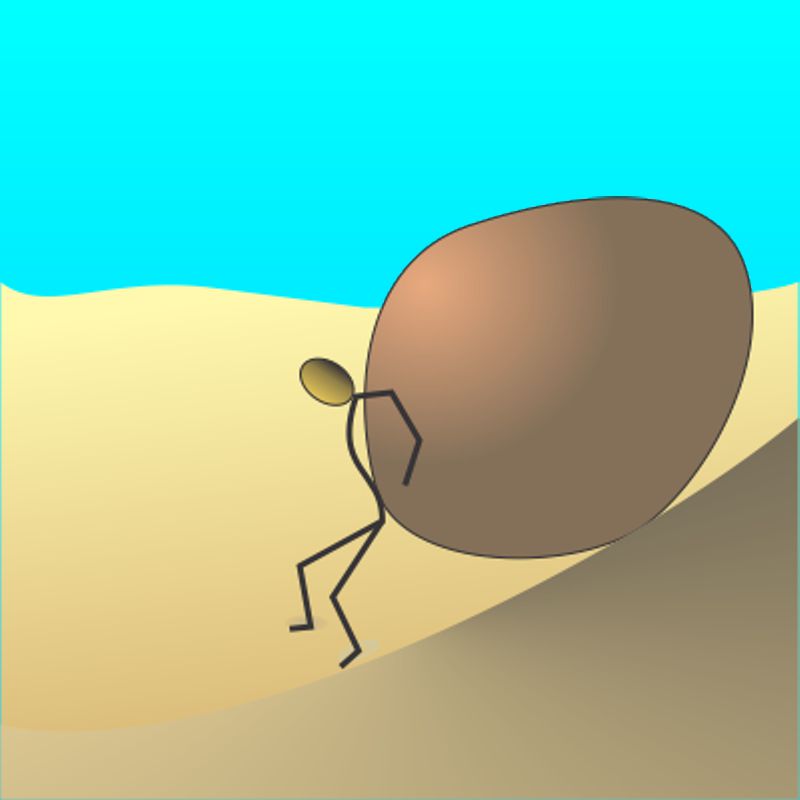
Sisyphus on A Sand Dune

I’m walking the park’s paths on a lovely early Spring day when, “There you are, Moire. I got a question!”

“As you always do, Mr Feder. What’s your question this time?”

“OK, this guy’s saying that life is all about fighting entropy but entropy always increases anyway. I seen nothing in the news about us fighting entropy so where’s he get that? Why even bother if we’re gonna lose anyway? Where’s it coming from? Can we plug the holes?”

“That’s 4½ questions with a lot of other stuff hiding behind them. You’re going to owe me pizza at Eddie’s AND a double-dip gelato.”

“You drive a hard bargain, Moire, but you’re on.”

“Deal. Let’s start by clearing away some underbrush. You seem to have the idea that entropy’s a thing, like water, that it flows around and somehow seeps into our Universe. None of that’s true.”

“That makes no sense. How can what we’ve got here increase if it doesn’t come from somewhere?”

“Ah, I see the problem — conservation. Physicists say there are two kinds of quantities in the Universe — conserved and non‑conserved. The number of cards in a deck is is a conserved quantity because it’s always 52, right?”

“Unless you’re in a game with Eddie.”

“You’ve learned that lesson, too, eh? With Eddie the system’s not closed because he occasionally adds or removes a card. Unless we catch him at it and that’s when the shouting starts. So — cards are non-conserved if Eddie’s in the game. Anyway, energy’s a conserved quantity. We can change energy from one form to another but we can’t create or extinguish energy, OK?”

“I heard about that. Sure would be nice if we could, though — electricity outta nothing would save the planet.”

“It would certainly help, and so would making discarded plastic just disappear. Unfortunately, mass is another conserved quantity unless you’re doing subatomic stuff. Physicists have searched for other conserved quantities because they make calculations simpler. Momentum‘s one, if you’re careful how you define it. There’s about a dozen more. The mass of water coming out of a pipe exactly matches the mass that went in.”

“What if the pipe leaks?”

“Doesn’t matter where the water comes out. If you measure the leaked mass and the mass at the pipe’s designed exit point the total outflow equals the inflow. But that gets me to the next bit of underbrush. Energy’s conserved, that’s one of our bedrock rules, but energy always leaks and that’s another bedrock rule. The same rule also says that matter always breaks into smaller pieces if you give it a chance though that’s harder to calculate. We measure both leakages as entropy. Wherever you look, any process that converts energy or matter from one form to another diverts some fraction into bits of matter in random motion and that’s an increase of entropy. One kind of entropy, anyway.”

“Fine, but what’s all this got to do with life?”

“It’s all to get us to where we can talk about entropy in context. You’re alive, right?”

“Last I looked.”

“Ever break a bone?”

<taps his arm> “Sure, hasn’t everybody one time or another?”

“Healed up pretty well, I see. Congratulations. Right after the break that arm could have gone in lots of directions it’s not supposed to — a high entropy situation. So you wore a cast while your bone cells worked hard to knit you together again and lower that entropy. Meanwhile, the rest of your body kept those cells supplied with energy and swept away waste products. You see my point?”

“So what you’re saying is that mending a broken part uses up energy and creates entropy somewhere even though the broken part is less random. I got that.”

“Oh, it goes deeper than that. If you could tag one molecule inside a living cell you’d see it bouncing all over the place until it happens to move where something grabs it to do something useful. Entropy pushes towards chaos, but the cell’s pattern of organized activity keeps chaos in check. Like picnicking on a windy day — only constant vigilance maintains order. That’s the battle.”

“Hey, lookit, Eddie’s ain’t open. I’ll owe you.”

“Pizza AND double-dip gelato.”

~~ Rich Olcott

Presbyopic Astronomy

Her phone call done, Cathleen returns to the Spitzer Memorial Symposium microphone with her face all happiness. “Good news! Jim, the grant came through. Your computer time and telescope access are funded. Woo-hoo!!”

<applause across the audience and Jim grins and blushes>

Cathleen still owns the mic. “So I need to finish up this overview of Spitzer highlights. Where was I?”

Maybe-an-Art-major tries to help. “The middle ground of our Universe.”

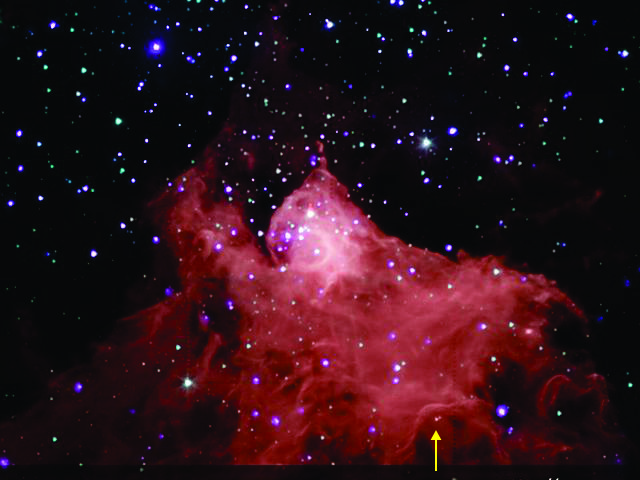
“Ah yes, thanks. So we’ve looked at close-by stars but Spitzer showed us a few more surprises lurking in the Milky Way. This, for instance — most of the image is colorized from the infra‑red, but if you look close you can see Chandra‘s X‑ray view, colorized purple to highlight young stars.”

The Cepheus-B molecular cloud
X-ray: NASA/CXC/PSU/K. Getman et al.; IRL NASA/JPL-Caltech/CfA/J. Wang et al

<hushed general “oooo” from the audience>

“Giant molecular clouds like this are scattered throughout the Milky Way, mostly in the galaxy’s spiral arms. As you see, this cloud’s not uniform, it has clumps and voids. By Earth standards the cloud is still a pretty good vacuum. The clumps are about 10-15 of our atmosphere’s density, but that’s still a million times more dense than our Solar System’s interplanetary space. The clumps appear to be where new stars are born. The photons and other particles from a newly-lit star drive the surrounding dust away. My arrow points to one star with a particularly nice example of that — see the C-shape around the star?”

The maybe-an-Art-major pipes up. “How about that one just a little below center?”

“Uh-huh. There’s so much activity in that dense region that the separate shockwaves collide to create hot spots that’ll generate even more stars in the future. The clouds are mostly held together by their own gravity. They last for tens of millions of years, so we think of them as huge roiling stellar nurseries.”

“Like my kid’s day care center but bigger.”

“Mm-mm, but let’s turn to the Milky Way’s center, home of that famous black hole with the mass of four million Suns and this remarkable structure, a double-helix of warm dust.”

False-color infra-red image of the Double-Helix Nebula
The double helix nebula.
Credit: NASA/JPL-Caltech/M. Morris (UCLA)

Vinnie blurts out, “That’s a jet from a black hole! One of Newt’s babies.”

Newt can’t resist breaking into Cathleen’s pitch. “Maybe it’s a jet, Vinnie. Yes, it’s above the central galactic plane and perpendicular to it, but the helix doesn’t quite point to the central black hole.”

“So take another picture that follows it down.”

“We’d love to, but we can’t. Yet. That image came from a long-wavelength instrument that only operated during Spitzer‘s initial 5-year cold period. Believe me, there are bunches of astronomers who can’t wait for the James Webb Space Telescope‘s far-IR instruments to get into position and start doing science. Meanwhile, we’ve got just the one image and a few earlier ones from an even less-capable spacecraft. This thing may be a lit-up part of a longer structure that twists down to the black hole or at least its accretion disk. We just don’t know.”

Cathleen takes control again. “The next image comes from outside our galaxy — far outside.”

Spitzer visualization of Galaxy MACS 1149-JD1
Credit: NASA/ESA/STScI/W. Zheng (JHU), and the CLASH team

The maybe-an-Art-major snorts, “Pointillism derivative!”

“No, it’s pixels from a starfield image with a very low signal-to-noise ratio. That red blotch in the center is one of the most distant objects ever observed, gracefully named MACS 1149-JD1. It’s a galaxy 13.2 billion lightyears away. That’s so far away that the expansion of the Universe has stretched the galaxy’s emitted photons by a factor of 10.2. Spectrum-wise, 1149-JD1’s ultra-violet light skipped right past the visible range and down into the near infra-red. Intensity-wise, that galaxy’s about 5200 times further away than the Andromeda galaxy. Assuming the two are about the same overall brightness, 1149-JD1 would be about 27 million times fainter than Andromeda.”

“How can we even see anything that dim?”

“We couldn’t, except for a fortunate coincidence. Right in line between us and 1149-JD1 there’s a massive galaxy cluster whose gravity acts like a lens to focus 1149-JD1’s light.”

The seminar’s final words, from maybe-an-Art-major — “A distant light, indeed.”

~~ Rich Olcott

Myopic Astronomy

Cathleen goes into full-on professor mode. “OK folks, settle down for the final portion of “IR, Spitzer and The Universe,” our memorial symposium for the Spitzer Space Telescope which NASA retired on January 30. Jim’s brought us up to speed about what infra-red is and how we work with it. Newt’s given us background on the Spitzer and its fellow Great Observatories. Now it’s my turn to show some of what Astronomy has learned from Spitzer. Thousands of papers have been published from Spitzer data so I’ll just skim a few highlights, from the Solar System, the Milky Way, and the cosmological distance.”

“Ah, Chinese landscape perspective,” murmurs the maybe-an-Art-major.

“Care to expand on that?” Cathleen’s a seasoned teacher, knows how to maintain audience engagement by accepting interruptions and then using them to further her her own presentation.

“You show detail views of the foreground, the middle distance and the far distance, maybe with clouds or something separating them to emphasize the in‑between gaps.”

“Yes, that’s my plan. Astronomically, the foreground would be the asteroids that come closer to the Earth than the Moon does. Typically they reflect about as much light as charcoal so our visible-light telescopes mostly can’t find them. But even though asteroids are as cold as interplanetary space that’s still above absolute zero. The objects glow with infra-red light that Spitzer was designed to see. It found hundreds of Near-Earth Objects as small as 6 meters across. That data helped spark disaster movies and even official conversations about defending us from asteroid collisions.”

<A clique in the back of the room> “Hoo-ahh, Space Force!

Some interruptions she doesn’t accept. “Pipe down back there! Right, so further out in the Solar System, Spitzer‘s ability to detect glowing dust was key to discovering a weird new ring around Saturn. Thanks to centuries of visible‑range telescope work, everyone knows the picture of Saturn and its ring system. The rings together form an annulus, an extremely thin circular disk with a big round hole in the middle. The annulus is bright because it’s mostly made of ice particles. The annulus rotates to match Saturn’s spin. The planet’s rotational axis and the annulus are both tilted by about 27° relative to Saturn’s orbit. None of that applies to what Spitzer found.”

Vinnie’s voice rings out. “It’s made of dust instead of ice, right ?”

Cathleen recognizes that voice. “Good shot, Vinnie, but the differences don’t stop there. The dust ring is less a disk than a doughnut, about 200 thousand times thicker than the icy rings and about 125 times wider than the outermost ice ring. But the weirdest part is that the doughnut rotates opposite to the planet and it’s in Saturn’s orbital plane, not tilted to it. It’s like the formation’s only accidentally related to Saturn. In fact, we believe that the doughnut and its companion moon Phoebe came late to Saturn from somewhere else.”

She takes a moment for a sip of coffee. “Now for the middle distance, which for our purpose is the stars of the Milky Way. Spitzer snared a few headliners out there, like TRAPPIST-1, that star with seven planets going around it. Visible-range brightness monitoring suggested there was a solar system there but Spitzer actually detected light from individual planets. Then there’s Tabby’s Star with its weird dimming patterns. Spitzer tracked the star’s infra‑red radiance while NASA’s Swift Observatory tracked the star’s emissions in the ultra‑violet range. The dimming percentages didn’t match, which ruled out darkening due to something opaque like an alien construction project. Thanks to Spitzer we’re pretty sure the variation’s just patchy dust clouds.”

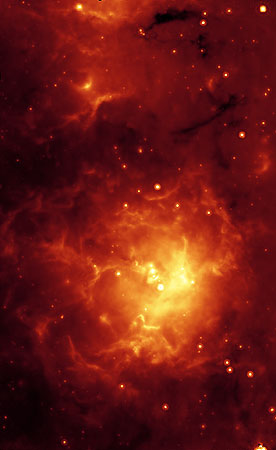
Spitzer view of the Trifid Nebula
Credit: NASA/JPL-Caltech/J. Rho (SSC/Caltech)

<from the crowd in general> “Awww.”

“I know, right? Anyway, Spitzer‘s real specialty is inspecting warm dust, so no surprise, it found lots of baby stars embedded in their dusty matrix. Here’s an example. This image contains 30 massive stars and about 120 smaller ones. Each one has grown by eating the dust in its immediate vicinity and having lit up it’s now blowing a bubble in the adjacent dust.” <suddenly her cellphone rings> “Oh, sorry, this is a call I’ve got to take. Talk among yourselves, I’ll be right back.”

~~ Rich Olcott

The Fourth Brother’s Quest

Newt Barnes is an informed and enthusiastic speaker in Cathleen’s “IR, Spitzer and the Universe” memorial symposium. Unfortunately Al interrupts him by bustling in to refresh the coffee urn.

After the noise subsides, Newt picks up his story. “As I was saying, it’s time for the Spitzer‘s inspirational life story. Mind you, Spitzer was designed to inspect very faint infra-red sources, which means that it looks at heat, which means that its telescope and all of its instruments have to be kept cold. Very cold. At lift-off time, Spitzer was loaded with 360 liters of liquid helium coolant, enough to keep it below five Kelvins for 2½ years.”

“Kelvins?”

“Absolute temperature. That’d be -268°C or -450°F. Very cold. The good news was that clever NASA engineers managed to stretch that coolant supply an extra 2½ years so Spitzer gave us more than five years of full-spectrum IR data.”

<mild applause>

“Running out of coolant would have been the end for Spitzer, except it really marked a mid-life transition. Even without the liquid helium, Spitzer is far enough from Earth’s heat that the engineers could use the craft’s solar arrays as a built-in sunshield. That kept everything down to about 30 Kelvins. Too warm for Spitzer‘s long-wavelength instruments but not too warm for its two cameras that handle near infra-red. They chugged along just fine for another eleven years and a fraction. During its 17-year life Spitzer produced pictures like this shot of a star-forming region in the constellation Aquila…”

NASA/JPL-Caltech/Milky Way Project.

The maybe-an-Art-major goes nuts, you can’t even make out the words, but Newt barrels on. “Here’s where I let you in on a secret. The image covers an area about twice as wide as the Moon so you shouldn’t need a telescope to spot it in our Summertime sky. However, even on a good night you won’t see anything like this and there are several reasons why. First, the light’s very faint. Each of those color-dense regions represents a collection of hundreds or thousands of young stars. They give off tons of visible light but nearly all of that is blocked by their dusty environment. Our nervous system’s timescale just isn’t designed for capturing really faint images. Your eye acts on photons it collects during the past tenth of a second or so. An astronomical sensor can focus on a target for minutes or hours while it accumulates enough photons for an image of this quality.”

“But you told us that Spitzer can see through dust.”

“That it can, but not in visible colors. Spitzer‘s cameras ignored the visible range. Instead, they gathered the incoming infrared light and separated it into three wavelength bands. Let’s call them long, medium and short. In effect, Spitzer gave us three separate black-and-white photos, one for each band. Back here on Earth, the post-processing team colorcoded each of those photos — red for long, green for medium and blue for short. Then they laid the three on top of each other to produce the final image. It’s what’s called ‘a falsecolor image’ and it can be very informative if you know what to look for. Most published astronomical images are in fact enhanced or colorcoded like this in some way to highlight structure or indicate chemical composition or temperature.”

“What happened after the extra extra years?”

“Problems had just built up. Spitzer doesn’t orbit the Earth, it orbits the Sun a little bit slower than Earth does. It gets further away from us every minute. It used to be able to send us its data almost real-time, but now it’s so far away a 2hour squirt-cast drains its batteries. Recharging the batteries using Spitzer‘s solar arrays tilts the craft’s antenna away from Earth — not good. Spitzer‘s about 120° behind Earth now and there’ll come a time when it’ll be behind the Sun from us, completely out of communication. Meanwhile back on Earth, the people and resources devoted to Spitzer will be needed to run the James Webb Space Telescope. NASA decided that January 30 was time to pull the plug.”

Cathleen takes the mic. “Euge, serve bone et fidélis. Well done, thou good and faithful servant.”

~~ Rich Olcott

A Tale of Four Brothers

Jim hands the mic to Cathleen, who announces, “Bio-break time. Please be back here in 15 minutes for the next speaker. Al will have fresh coffee and scones for us.” <a quarter-hour later> “Welcome back, everyone, to the next session of our ‘IR, Spitzer and the Universe‘ memorial symposium. Our next speaker will turn our focus to the Spitzer Space Telescope itself. Newt?”

“Thanks, Cathleen. Let’s start with a portrait of Spitzer. I’m putting this up because Spitzer‘s general configuration would fit all four of NASA’s Great Observatories…

A NASA artist’s impression of Spitzer against an IR view of the Milky Way’s dust

“Each of them was designed to be carried into space by one of NASA’s space shuttles so they had to fit into a shuttle’s cargo bay — a cylinder sixty feet long and fifteen feet in diameter. Knock off a foot or so each way to allow for packing materials and loading leeway.”

<voice from the crowd> “How come they had to be in space? It’d be a lot cheaper on the ground.”

“If you’re cynical you might say that NASA had built these shuttles and they needed to have some work for them to do. But the real reasons go back to Lyman Spitzer (name sound familiar?). Right after World War II he wrote a paper listing the benefits of doing Astronomy outside of our atmosphere. We think Earth’s atmosphere is transparent, but that’s only mostly true and only at certain wavelengths. Water vapor and other gases block out great swathes of the infrared range. Hydrogen and other atoms absorb in the ultraviolet and beyond. Even in the visible range we’ve got dust and clouds. And of course there’s atmospheric turbulence that makes stars twinkle and astronomers curse.”

“So he wanted to put telescopes above all that.”

“Absolutely. He leveraged his multiple high-visibility posts at Princeton, constantly promoting government support of high-altitude Astronomy. He was one of the Big Names behind getting NASA approved in the first place. He lived to see the Hubble Space Telescope go into service, but unfortunately he died just a couple of years before its IR companion was put into orbit.”

“So they named it after him?”

“They did, indeed. The Spitzer was the fourth and final product of NASA’s ‘Great Observatories’ program designed to investigate the Universe from beyond Earth’s atmosphere. The Hubble Space Telescope was first. It was built to observe visible light but it also gave NASA experience doing unexpected inflight satellite repairs. <scattered chuckles in the audience. The maybe-an-Art-major nudges a neighbor for a whispered explanation.> The Atlantis shuttle put Hubble into orbit in 1990. Thirty years later it’s still producing great science for us.”

<The maybe-an-Art-major yells out> “And beautiful pictures!”

“Yes, indeed. OK, a year later Atlantis put Compton Gamma Ray Observatory into orbit. Its sensors covered a huge range of the spectrum, about twenty octaves as Jim would put it, from hard X-rays on upward. In its nine years of life it found nearly 300 sources for those high-energy photons that we still don’t understand. It also detected some 2700 gamma ray bursts and that’s something else we don’t understand other than that they’re way outside our intergalactic neighborhood.”

“Only nine years?”

“Sad, right? Yeah, one of its gyroscopes gave out and NASA had to bring it down. Some people fussed, ‘It’ll come down on our heads and we’re all gonna die!‘ but the descent stayed under control. Most of the satellite burned up on re-entry and the rest splashed harmlessly into the Indian Ocean.”

<quiet snuffle>

“Cheer up, it gets better. A month and a half after Compton‘s end, the Columbia shuttle put Chandra X-Ray Observatory into orbit. Like Hubble, Chandra‘s still going strong and uncovering secrets for us. Chandra was first to record X-rays coming from the huge black hole at the Milky Way’s core. Chandra data from the Bullet Cluster helped confirm the existence of dark matter. Thanks to Chandra we understand Jupiter’s X-ray emissions well enough to steer the Juno spacecraft away from them. The good stuff just keeps coming.”

“Thanks, that helps me feel better.”

“Good, because it’s time for the Spitzer‘s inspirational life story.”

~~ Rich Olcott

A Far And Dusty Traveler

Cathleen takes the mic. “Quick coffee and scone break, folks, then Jim will continue our ‘IR, Spitzer And The Universe‘ symposium.” <pause> “OK, we’re back in business. Jim?”

“Thanks, Cathleen. Well, we’ve discussed finding astronomical molecules with infra-red. Now for a couple of other IR applications. First up — looking at things that are really far away. Everyone here knows that the Universe is expanding, right?”

<general murmur of assent, although the probably-an-Art-major looks startled>

“Great. Because of the expansion, light from a far-away object gets stretched out to longer wavelengths on its way to us. Say a sodium atom shot a brilliant yellow-gold 590-nanometer photon at us, but at the time the atom was 12.5 million lightyears away. By the time that wave reaches us it’s been broadened to 3540 nanometers, comfortably into the infra-red. Distant things are redder, sometimes too red to see with an optical telescope. The Spitzer Space Telescope‘s infra-red optics let us see those reddened photons. And then there’s dust.”

<voice from the crowd> “Dust?”

Cosmic dust, pretty much all the normal matter that’s not clumped into stars and planets. Some of it is leftovers from early times in the Universe, but much of it is stellar wind. Stars continuously spew particles in their normal day-to-day operation. There’s a lot more of that when one explodes as a nova or supernova. Dust particles come in all sizes but most are smaller than the ones in tobacco smoke.”

<same voice> “If they’re so small, why do we care about them?”

“Two reasons. First, there’s a lot of them. Maybe only a thousand particles per cubic kilometer of space, but there’s a huge number of cubic kilometers in space and they add up. More important is what the dust particles are made of and where we found them. Close inspection of the dust is like doing astronomical archaeology, giving us clues about how stars and galaxies evolved.”

<Vinnie, skeptical as always> “So what’s infra-red got to do with dust?”

“Depends on what kind of astronomy you’re interested in. Dust reflects and emits IR light. Frequency patterns in the light can tell us what that dust made of. On the other hand there’s the way that dust doesn’t interact with infra-red.”

<several voices> “Wait, what?”

The Milky Way from Black Rock Desert NV
By Steve Jurvetson via Flickr, Wikimedia Commons, CC BY 2.0

“If Al’s gotten his video system working … ah, he has and it does. Look at this gorgeous shot of the Milky Way Galaxy. See all the dark areas? That’s dust blocking the visible light. The scattered stars in those areas are simply nearer to us than the clouds. We’d like to study what’s back beyond the clouds, especially near the galaxy’s core. That’s a really interesting region but the clouds block its visible light. Here’s the neat part — the clouds don’t block its infra-red light.”

<other voices> “Huh?” “Why wouldn’t they?”

“It’s the size of the waves versus the size of the particles. Take an extreme case — what’s the wavelength of Earth’s ocean tides?”

<Silence, so I speak up.> “Two high tides a day, so the wavelength is half the Earth’s circumference or about 12’500 miles.”

“Right. Now say you’re at the beach and you’re out there wading and the water’s calm. Would you notice the tide?”

“No, rise or fall would be too gentle to affect me.”

“Now let’s add a swell whose peak-to-peak wavelength is about human-height scale.”

“Whoa, I’d be dragged back and forth as each wave passes.”

“Just for grins, let’s replace that swell with waves the same height but only a millimeter apart. Oh, and you’re wearing SCUBA equipment.”

“Have mercy! Well, I should be able to stand in place because I wouldn’t even feel the peaks and troughs as separate waves, just a foamy massage. Thanks for the breathing assistance, though.”

“You’re welcome, and thanks for helping with the thought experiment. Most cosmic dust particles are less than 100 nanometers across. Infra-red wavelengths run 100 to 1000 times longer than that. Infra-red light from those cloud-hidden stars just curves around particles that can stop visible lightwaves cold. Spitzer Space Telescope and its IR-sensitive kin provide deeper and further views than visible light allows.”

~~ Rich Olcott

Above The Air, Below The Red

Vinnie and I walk into Al’s coffee shop just as he sets out a tray of scones. “Odd-looking topping on those, Al. What is it?”

“Dark cherry and dark chocolate, Sy. Something about looking infra-red. Cathleen special-ordered them for some Astronomy event she’s hosting in the back room. Carry this tray in there for me?”

Vinne grabs the tray and a scone. “Sure, Al. … Mmm, tasty. … Hi, Cathleen. Here’s your scones. What’s the event?”

“It’s a memorial symposium for the Spitzer Space Telescope, Vinnie. Spitzer‘s been an infra-red workhorse for almost 17 years and NASA formally retired it at the end of January.”

“What’s so special about infra-red? It’s just light, right? We got the Hubble for that.”

“A perfect cue for Jim’s talk. <to crowd> Grab a scone and settle down, everyone. Welcome to our symposium, ‘IR , Spitzer And The Universe.’ Our first presentation today is entitled ‘What’s So Special About Infra-red?‘ Jim, you’re on.”

“Thanks, Cathleen. This is an introductory talk, so I’ll keep it mostly non-technical. So, question for everybody — when you see ‘IR‘, what do you think of first?”

<shouts from the crowd> “Pizza warmer!” “Invisible light!” “Night-vision goggles!”

“Pretty much what I expected. All relevant, but IR’s much more than that. To begin with, many more colors than visible light. We can distinguish colors in the rainbow because each color’s lightwave has a different frequency. Everybody OK with that?”

<general mutter of assent>

“OK. Well, the frequency at the violet end of the visible spectrum is a bit less than double the frequency at the red end. In music when you double the frequency you go up an octave. The range of colors we see from red to violet is less than an octave, about like going from A-natural to F-sharp on the piano. The infra-red spectrum covers almost nine octaves. An 88-key piano doesn’t even do eight.”

<voice from the crowd, maybe an Art major> “Wow, if we could see infra-red think of all the colors there’d be!”

“But you’d need a whole collection of specialized eyes to see them. With light, every time you go down an octave you reduce the photon’s energy capacity by half. Visible light is visible because its photons have just enough energy to cause an electronic change in our retinas’ photoreceptor molecules. Five octaves higher than that, the photons have enough energy to knock electrons right out of a molecule like DNA. An octave lower than visible, almost nothing electronic.”

<Vinnie’s always-skeptical voice> “If there’s no connecting with electrons, how does electronic infra-red detection work?”

“Two ways. A few semiconductor configurations are sensitive to near- and mid-infra-red photons. The Spitzer‘s sensors are grids of those configurations. To handle really low-frequency IR you have to sense heat directly with bolometer techniques that track expansion and contraction.”

<another skeptical voice> “OK then, how does infra-red heating work?”

“Looks like a paradox, doesn’t it? Infra-red photons are too low-energy to make a quantum change in a molecule’s electronic arrangement, but we know that the only way photons can have an effect is by making quantum changes. So how come we feel infra-red’s heat? The key is, photons can interact with any kind of charged structure, not just electrons. If a molecule’s charges aren’t perfectly balanced a photon can vibrate or rotate part of a molecule or even the whole thing. That changes its kinetic energy because molecular motion is heat, right? Fortunately for the astronomers, gas vibrations and rotations are quantized, too. An isolated water molecule can only do stepwise changes in vibration and rotation.”

“Why’s that fortunate?”

“Because that’s how I do my research. Every kind of molecule has its own set of steps, its own set of frequencies where it can absorb light. The infra-red range lets us do for molecules what the visual range lets us do for atoms. By charting specific absorption bands we’ve located and identified interstellar clouds of water, formaldehyde and a host of other chemicals. I just recently saw a report of ‘helonium‘, a molecular ion containing helium and hydrogen, left over from when the Universe began. Infra-red is so cool.”

“No, it’s warm.”

Image suggested by Alex

~~ Rich Olcott